Download
1 / 39
390 likes | 500 Vues
This study delves into the physical structure of high-mass star forming regions, investigating the formation mechanisms of massive stars. Research includes observation of hot cores, UCHII regions, and H2O masers as potential evolutionary indicators. Challenges in observational techniques, like SED classification and broad linewidths, are addressed. The study highlights the need for a comprehensive analysis of high-mass cores in the Milky Way through various surveys and modeling techniques.

E N D
Deriving the Physical Structure of High-mass Star Forming Regions Yancy L. Shirley Collaborators: Neal Evans, Kaisa Young, Dan Jaffe, Claudia Knez, & Jingwen Wu May 2003
SF in the Milky Way • 1011 stars in the Milky Way • Evidence for SF throughout history of the galaxy (Gilmore 2001) • SF occurs in molecular gas • Molecular cloud complexes: M < 107 M0(Elmegreen 1986) • Isolated Bok globules M > 1 M0(Bok & Reilly 1947) • SF traces spiral structure(Schweizer 1976) M51 Central Region NASA
SF Occurs in Molecular Clouds Lupus • Total molecular gas = 1 – 3 x 10⁹ Mo • SF occurring throughout MW disk (Combes 1991) • SF occurs in isolated & clustered modes • SF occurs within dense molecular cores BHR-71 Pleiades VLT
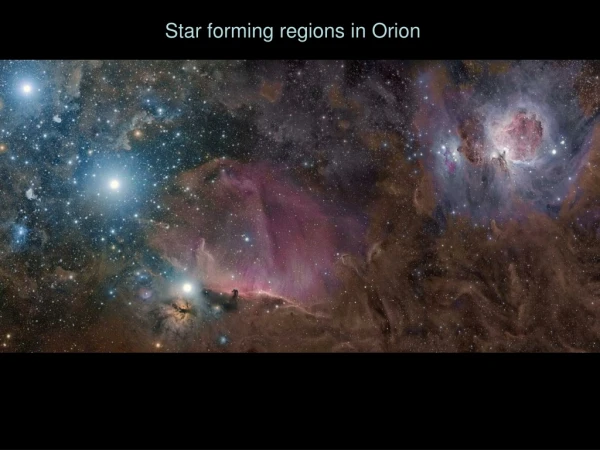
Orion Dense Cores CO J=2-1 VST, IOA U Tokyo Lis, et al. 1998
High-mass Dense Cores Optical RCW 38 • Embedded clusters visible in Near-IR W42 Near-IR Blum, Conti, & Damineli 2000 J. Alves & C. Lada 2003
High-mass Cores : Complexity S106 Near- IR Subaru
Star with M > 100 Mo appear to exist (Kudritzki et al. 1992): How do massive stars (M > few M0) form? Basic formation mechanism debated: Accretion (McKee & Tan 2002) How do you form a star with M > 10 Msun before radiation pressure stops accretion? Coalescence (Bonnell et al. 1998) Requires high stellar density: n > 104 stars pc-3 Predicts high binary fraction among high-mass stars Theories predict dense core structure & evolution: n(r,t) & v(r,t) Observational complications: Farther away than low-mass regions = low resolution Dense cores may be forming cluster of stars = SED dominated by most massive star = SED classification confused! Very broad linewidths consistent with turbulent gas Potential evolutionary indicators from presence of : H2O, CH3OH masers Hot core Hyper-compact HII UCHII regions HII Star ? High-Mass Star Formation
Hot Cores & UCHII Regions • Hot Cores & UCHII Regions observed in same high-mass regions : W49A VLA 7mm Cont. BIMA DePree et al. 1997 Wilner et al. 1999
Outline • What is lacking is a fundamental understanding of the basic properties of the ensemble of high-mass star forming cores • Texas survey of high-mass star forming cores: • Plume et al. 1992 & 1997 CS line survey • Dust Continuum 350 mm Survey • Mueller, Shirley, Evans, & Jacobson 2002, ApJS • Constrain n( r ), T ( r ) • High-mass cores associated with H20 maser emission • Arectri catalog of H2O maser sources • Plume et al. 1992 & 1997CS survey towards (0,0) position • CS J = 5 -4 Mapping Survey • Shirley, Evans, Young, Knez, Jaffe 2003, ApJS • Dense gas properties
CS Dense Core Survey • CS J=7-6 detected 104 / 179 cores with H2O masers • Plume et al. 1992 • H2O masers trace very dense gas • n > 1010 cm-3 for the 22 GHz 616-523 transition • Low J CO Surveys generally trace lower density gas. • H2O maser positions are known accurately to within a few arcseconds. HII regions and luminous IR sources may not be spatially coincident with dense gas. • Multi-transition study and initial mapping • Plume et al. 1997 • 71 cores detected in CS and C34S J = 2-1, 3-2, 5-4, and 7-6. • 21 of the brightest cores mapped in CS 5-4 • <R> = 1.0 pc, <Mvir> = 3800 Mo • LVG modeling of multiple CS transitions
CO: Molecular Cloud Tracer CO J=3-2 Emission Hubble Telescope CSO NASA, Hubble Heritage Team
CS & HCN Trace Dense Cores CO 1-0 CS 2-1 HCN 1-0 Helfer & Blitz 1997
CS LVG Models • Initially assumed n( r ) and T( r ) = CONSTANT • 40 sources detected in all 4 CS transitions • <log n> = 5.93 (0.23) • <log N> = 14.42 (0.49) • 2-density component model with a filling factor for the dense component • nhigh ~ 108 cm-3 • nlow ~ 104 cm-3 • Typically, very high column densities of low density gas required (<log Nlow> = 16.16) with f ~ 0.2 Plume et al. 1997
350 mm Survey Mueller, Shirley, Evans, & Jacobson 2002 • 5 nights at the CSO 10.4-m telescope • 51 high-mass (Lbol > 100 Lsun) cores associated with H2O masers (Plume et al. 1992 sample) • 850 pc < D < 14 kpc • All cores also observed in CS5-4 survey (Shirley et al. 2003) • SHARC 350 mm scan maps (4.0 x 2.7 arcmin) • qmb ~ 14 arcsec at 350 mm • 100 arcsec chop throw
350 mm Images Mueller et al. 2002 W33A G9.62+0.10 M8E 10,000 AU 150,000 AU 50,000 AU W28A2 G23.95+0.16 W43
Submm Continuum Emission • Submillimeter continuum emission is optically thin. The specific intensity along a line-of-sight is given by:
Why must we model ? • Rayleigh-Jeans approximation fails in outer envelope of low-mass cores • hn/k = 44 K at 350 mm • Heating from ISRF is very important in outer envelopes of cores • Radiative transfer is optically thick at short l • Observed brightness distribution is convolved with complicated beam pattern, scanning, and chopping
Radiative Transfer Procedure nd(r) L kn Sn(l) I(b) Radiative Transfer Simulate Obs. Td(r) Nearly orthogonal constraints: SEDMass x Opacity I(b)n(r) Gas to Dust Physical Model n(r) Iterate Observations
Dust Opacity OH = Ossenkopf & Henning 1994 coagulated dust grains
Calculated Temperature Profiles Mueller et al. 2002
Radiative Transfer Models 50,000 AU Mueller et al. 2002
Best-fitted Power Law • Single power-law density profiles fit observations • n( r ) = nf (r / rf) –p • p = - dln n/ dln r • Distribution of power law indices • <p> = 1.8 (0.4) • Similar to distribution of low-mass cores modeled by Shirley et al. (2002) & Young et al (2003) Mueller et al. 2002
Evolutionary Indicators ? Mueller et al. 2002
“Standard” Indicators Mueller et al. 2002
350 mm Survey Summary • Density and Temperature structure of outer envelope characterized • <p> = 1.8 (0.4) • <n(1000 AU)> is order of magnitude higher than nearby low-mass star-forming cores • Beuther et al. 1.2mm mapping 69 cores: <p> = 1.6 (0.5) • Single power law models fit our sample • CAVEAT:may be contribution from compact components (UCHIIs or disks) within central beam • W3(OH) UCHII may contribute as much as 25% of the central flux assuming optically thick free-free scaled from 3mm flux (Wilner, Welch, & Forster 1995) • <Rdec> = 0.16 (0.10) pc • <Tiso> = 29 (9) K isothermal temperature • Definitive trends lacking for evolutionary indicators • Except perhaps Tbol vs. Lbol/Lsmm • Lbol ranges from 103 to 106 Lsun • SEDs not well contrained in many cases due to lack of Far-IR photometry
CS J = 5 - 4 Survey Shirley et al. 2002 • 63 high-mass star forming cores associated with H2O masers mapped at CSO 10.4m • <D> = 5.3 (3.7) kpc with 28 UCHII regions included • 57 peak positions observed in C34S J=5-4, 9 in 13CS J=5-4 • Over-sampled On-The-Fly mapsin CS J=5-4 • qmb ~ 25 arcsec at 245 GHz • Median peak integrated intensity S/N = 40 • 10 arcsec binned maps • Provide consistent sample from which to determine the properties of the deeply embedded phase of high-mass star formation
CS Rotational Transitions • Heavy linear molecule with many rotational transitions observable from the ground • J = 5 - 4 transition good probe of dense gas: • mb = 1.98 Debye • nc(10K) = 8.8 x 106 cm-3 • neff(10K) = 2.2 x 106 cm-3
CS J=5-4 Survey S158 Shirley et al. 2003 G19.61-0.23 M8E S231 W44 S76E
CS J=5-4 vs. Dust Continuum • CS J=5-4 is an excellent tracer of dense gas in high-mass star forming regions Shirley et al. 2003
Deconvolved Size vs. p • Convolution of a Gaussian beam pattern with a power law intensity profile yields a deconvolved source size that varies with p Shirley et al. 2003
Optical Depth Effect on Linewidth • C32S is typically optically thick, therefore must use rare isotope (C34S) in linewidth sensitive calculations Shirley et al. 2003
Linewidth-Size • Weak correlation with best fit: Dv ~ r0.3 • C34S linewidth 4x larger than predicted linewidth fromCasselli & Myers (1995) indicating high turbulence: <Dv(C34S)> = 5.0 (2.0) km/s Shirley et al. 2003
Size, Mass, & Pressure • Median core size: R = 0.32 pc • Alternatively Rn = 0.40 pc • Median projected aspect ratio: (a/b) = 1.2 • Median virial mass: Mvir = 920 M0 corresponding to S = 0.6 g cm-2 • Corrections for p and Dv broadening necessary • Mean mass per OB association ~ 440 M0(Matzner 2002) • Median pressure <P/k> = 1.5 x 10⁸ K cm-3 Shirley et al. 2003
Virial Mass vs. Dust Mass • The virial mass is consistently higher by a factor of 2 to 3 than the mass determined from dust continuum modeling. • Uncertainty in dust opacity may account for difference Shirley et al. 2003
Cumulative Mass Spectrum • Slope of mass spectrum similar to IMF and distribution of OB associations G ~ -1.1 (0.1)(Massey 1995) Shirley et al. 2003
Luminosity and Mass Shirley et al. 2003
CS J=5-4 Survey Summary • CS J=5-4 is an excellent tracer of dense gas in high-mass star forming cores • Aspect ratios consistent with spherical symmetry • Median size of 0.32 pc and median virial mass of 920 Msun • Virial mass a factor of 2 to 3 larger than dust-determined mass • Cumulative mass spectrum G ~ -0.9 similar to IMF of OB associations • High median pressure of 1.5 x 10⁸ K cm-3 ameliorates the lifetime problem for confinement of UCHII regions • L/M is 100x higher than estimates from CO and has a smaller dispersion • L/M 2x higher for cores with UCHII and/or HII regions • Lbol strongly correlates with Mvir. Combined with low dispersion of L/M perhaps indicates that mass of most massive star is related to the mass of the core
High Mass Pre-protocluster Core? • Have yet to identify initial configuration of high-mass star forming core! • No unbiased surveys for such an object made yet • Based on dense gas surveys, what would a 4500 M0, cold core (T ~ 10K) look like? • Does this phase exist? Evans et al. 2002
Conclusions & Future Work • Initial characterization of n( r ) indicates a power law density structure of outer envelope • CS J=5-4 traces dense gas properties associated with star formation • CS J=7-6 + HCN & H13CN J=3-2 Mapping Survey(Texas Thesis projects of Jingwen Wu & Claudia Knez) • Radiative transfer modeling of dense gas & v( r ) • Combination of bolometer camera + interferometric dust continuum imaging with radiative transfer modeling is a powerful diagnostic of the density & temperature • How much emission is coming from a compact component within central beam? • SMA & ALMA submm continuum needed! • SOFIA & SIRTF needed to improve SED