Download
1 / 53
550 likes | 753 Vues
Ground Water Flow in Aquifer Systems: Floridan Aquifer Case Study. Envi 518 September 10, 2002. Global Water Supply. Approximately 29% of the world’s fresh water resources exists in aquifers. Aquifers. Definition: A geological unit which can store and supply significant quantities of water.

E N D
Ground Water Flow in Aquifer Systems: Floridan Aquifer Case Study Envi 518 September 10, 2002
Global Water Supply • Approximately 29% of the world’s fresh water resources exists in aquifers
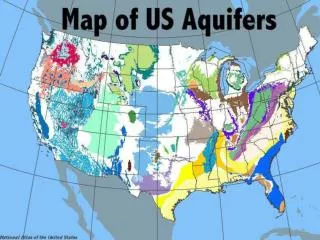
Aquifers Definition: A geological unit which can store and supply significant quantities of water. Principal aquifers by rock type: Unconsolidated Sandstone Sandstone and Carbonate Semiconsolidated Carbonate-rock Volcanic Other rocks
Ground Water Ground water occurs when water penetrates the subsurface through cracks and pores in soil and rock
Natural Precipitation melting snow Infiltration by streams and lakes Transpiration by plants Artificial Recharge wells Spread water over land in pits, furrows, ditches, or erect small dams in stream channels to detain and deflect water Recharge
Hydrologic Cycle– Rainfall in becomes Recharge to the water table Evapotranspiration Precipitation Runoff Infiltration Soil zone Unsaturated zone Recharge to water table Water table Saturated zone below the water table
Unhealthy vs. Healthy Lake Drawdown Cone of Depression Over Pumping Pumping Well
NTB Overpumping Impacts Excessive Groundwater Pumping has Caused: • Decline in aquifer water levels • Lowered water levels in lakes,wetlands & springs • Formation of sinkholes • Reduced flow in river systems • Seawater intrusion
Surface Water Issues Dock on Florida Lake in 1970’s Same Dock in 1990
Negative Impacts: Sinkholes Over 50,000 homeowners in South Pasco and North Hillsborough counties have been hit with massive land subsidence, as a result of over pumping.
Atmosphere CO2 H2O CO2 H2O Cover Sediment CaMg(CO3)3 CaCO3 H2CO3 Carbonate Bedrock Mg++ Ca++ HCO3- CO2 + H20 H2CO3 Sinkhole Formation • dissolution of soluble carbonate rocks by weakly acidic water • the process starts in the atmosphere, where rain falls on the ground and percolates through the soil • dissolves carbon dioxide gas from the air and soil, forming carbonic acid (H2CO3), a weak acid • carbonic acid percolates through the ground cover down to the bedrock • carbonic acid reacts with limestone and dolomite and dissolves these carbonate rocks into component ions of calcium (Ca2+), magnesium (Mg2+) and bicarbonate (HCO3-).
Negative Impacts: Wetlands Overpumping has negative effects on surface waters as well – wetlands in the area continue to dry out
Thomas Camp Radius of Influence: South Pasco Wellfield
“Thirsty Tampa Bay ponders huge desalination plant” April 20, 2000 • Want to build the largest desalination plant in • the Western Hemisphere • Projected cost of $100 million • Could supply about 25 MGD • (about 1/10 of the region's needs) • Critics are concerned that the high salinity wastewater pumped back into the bay will hurt the environment.
Rainfall/Recharge 53 rainfall observation points Monthly Readings from January 1989-January 2000
Rainfall to Recharge Assigned rain gages to basins & used recharge equation from previous studies: Rech (node) = Radj* ((Rechss/P(b,ss))*P(b,m) Radj = Runoff adjustment per basin per month Rechss = Recharge of node in May 1989 Steady State Model P(b,ss) = May 1989 Rainfall per Basin P(b,m) = Rainfall per basin per month
Uses of Modeling • A model is designed to represent reality in such a way that the modeler can do one of several things: • Quickly estimate certain aspects of a system (screening models, analytical solutions, “back of the envelope” calculations) • Determine the causes of an observed condition (contamination, subsidence, flooding) • Predict the effects of changes to the system (remediation, development, waste disposal)
Types of Ground Water Models • Analytical Models • 1-D solution, Ogata and Banks (1961) • 2-D solution, Wilson and Miller (1978) • 3-D solutions, Domenico & Schwartz (1990) • Numerical Models • Flow-only models (MODFLOW) • Transport-only models (MT3D, RT3D, MODPATH, etc.) • Require a coordinated flow model, such as MODFLOW • Combined flow and transport models (BIOPLUME, FEMWATER, FLOTRAN)
NTB Model & MODFLOW • Three dimensional finite difference groundwater flow model (McDonald & Harbaugh, 1988) • Simulates horizontal flow based on following inputs: • Aquifer properties - Pumpage • Recharge - Evapotranspiration • River/spring flow - General Head Boundaries • Allows for vertical interchange between layers Surficial Aquifer Upper Floridan (1) Upper Floridan (2)
Hernando Pasco Polk Hillsborough Pinellas NTB MODFLOW Model Description • GMS • Encompasses all/or part of five counties • 1500 mile2 area • Variable grid spacing (0.25 - 1.0 miles2) • 62 Rows & 69 Columns • Three layers
MODFLOW • Cell-centered, 3D, finite difference groundwater flow model • Iterative solver • Initial values of heads are provided • Heads are gradually changed through “time steps” until governing equation is satisfied • Divided into a series of packages • Each package forms a specific task • Each package stored in a separate input file
MODFLOW • MODFLOW based on the following partial differential equation for three-dimensional movement of groundwater of constant density through porous earth material : • Kxx, Kyy, and Kzz = hydraulic conductivity (x, y, and z axis) • h = potentiometric head • W = volumetric flux per unit volume pumped • Ss = specific storage of the porous material • t = time
Recharge Equation • Assigned rain gages to basins & used recharge equation from previous studies: Rech (node) = Radj * ((Rechss/P(b,ss))*P(b,m) Radj = Runoff adjustment per basin per month Rechss = Recharge parameter in May 1989 Steady State Model P(b,ss) = May 1989 Rainfall per Basin P(b,m) = Rainfall per basin per month
Runoff Parameter (5) (10) (1) (4) (8) (6) (2) (7) (9) (3)
Calibration Quotient Recharge Parameter for Calibrated Model Thiessen Polygons for May 1989 precipitation
MODFLOW Inputs • Recharge/Rainfall • Variable parameter, dependent on type of rainfall used in recharge calculation • Pumping Well Data • Over 1500 wells used for pumping information • Starting Heads • Starting heads interpolated from May 2000 data, Inverse Distance Weighted Method • Observation Coverage–544 Observation Points • Created per layer in the grid for each month; data were obtained from District monitoring wells
Qualitative Analysis Ending Heads for NxrdRaw run for Layer 2
Quantitative Analysis where hc = computed head, ho = observed head and n = number of observations
The Edwards Aquifer Pumpage to Date: 33,035.30 mg (million gallons) Average Daily Pumpage: 144.26 mg Minimum Edwards Level for 2000: 649.7’ Historic Minimum (8/17/56): 612.5’ Maximum Edwards Level for 2002: 690.5’ Historic Maximum (6/14/92): 703.3’
The Edwards Aquifer • When the limestone was exposed, it was extensively eroded creating cavities and conduits making it capable of holding and transmitting water • Then it was covered over with relatively impermeable sediments forming a confining unit
Geology of Edwards Aquifer • Primary geologic unit is Edwards Limestone • one of the most permeable and productive aquifers in the U.S. • The aquifer occurs in 3 distinct segments: • -The drainage, recharge, and artesian zones
Drainage Zone of Edwards Aquifer • located north and west of the aquifer in the region referred to as the Edwards Plateau or Texas Hill Country • largest part of the aquifer spanning 4400 sq. miles • water in this region travels to recharge zone
Recharge Zone of Edwards Aquifer • Geologically known as the Balcones fault zone • It consists of an abundance of Edwards Limestone that is exposed at the surface • -provides path for water to reach the artesian zone
Artesian Zone of Edwards Aquifer • The artesian zone is a complex system of interconnected voids varying from microscopic pores to open caverns • located between 2 relatively less permeable layers that confine and pressure the system • underlies 2100 square miles of land
Artesian Wells • A well whose source of water is a confined aquifer • The water level in artesian wells is at some height above the water table due to the pressure of the aquifer • This level is the potentiometric surface and if it is above the land surface, it is considered a flowing artesian well
The Edwards Group • The Edwards limestone is between 300-700 ft. thick • Outcrops at the surface is tilted downward to the south and east and is overlain by younger limestone layers and thousands of feet of sediment • The immense weight of this sediment layer caused faulting in the region