Understanding Maximum Likelihood Estimation in Statistical Models
320 likes | 454 Vues
This document provides an in-depth exploration of maximum likelihood estimation (MLE) as a fundamental tool in statistical inference. It covers essential concepts including likelihood functions, uncertainty, and variations in data. The chapters outline how MLE is applied to different distributions, such as Normal and Poisson, and explain how to derive estimates from observed data. Additionally, it discusses the significance of log-likelihood and its applications, enhancing understanding of statistical modeling and inference processes.

Understanding Maximum Likelihood Estimation in Statistical Models
E N D
Presentation Transcript
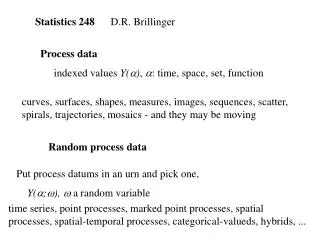
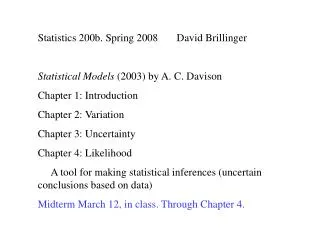
Statistics 200b. Spring 2008 David Brillinger Statistical Models (2003) by A. C. Davison Chapter 1: Introduction Chapter 2: Variation Chapter 3: Uncertainty Chapter 4: Likelihood A tool for making statistical inferences (uncertain conclusions based on data) Midterm March 12, in class. Through Chapter 4.
Chapter 4: Likelihood. "value y of r.v. Y with p.d.f f(y;) in f known" "goal to make statements about distribution of Y based on observed data y" that are plausible, given y observed"
Likelihood, L. L() = f(y;) in regarded as function of for fixed y "L will be relatively larger for near that which generated the data" When Y's i.i.d., y = (y1,...,yn) sample L() = f(y;) = f(yj;)
Normal. IN(,2) = (,2) data: (y1,...,yn) L() = f(yj;) = [exp{-(yj- )2/2 2 } / {2} ] l() = log L() = - { log 2 }/2 - { (yj - )2}/2 2
An aside One sees that all one needs is l() is a maximum at
Poisson. L() = y exp{-} / y!>0, y = 0,1,2,3,... Goes to 0 as 0 or Maximum at = y sample y = (y1,...,yn) f(yj;) = ^(y1+...+yn) exp{-n} / C Maximum at =
Exponential distribution f(y;) = -1 exp{-y/} y > 0 > 0 L() = f(yj;) = -n exp{-(y1+...+yn)/} Maximum at =
Spring failure at 950 N/mm2 225 171 198 189 189 135 162 135 117 162 103 cycles 1 | 244 1 | 66799 2 | 03 decimal point is 2 digit(s) to the right of the | L() maximized at approx 168 L(168) = 2.49E-27 L(150) = 2.32E-27 150 is .93 times less likely than 168 Might declare s with L() > .5 L(168) "plausible"
Spring failure times at stress 950 N/mm2 225 171 198 189 135 162 135 117 162 units of 1000 cycles stleaf L() maximized at theta approx 168 L(168) approx 2.49E-27 L(150) approx 2.32E-27 "150 is .93 times less likely that 168" Values with L() > .5 L(168) " plausible": (120,260)
Weibull. f(y;,) = y-1 exp{-(y/)}/ y>0 , > 0 L(,) = f(yj;,) Contour plot of log L(,) Maximized at approx (181,6) Exponential for = 1 dotted line
Challenger data. Space shuttle exploded after launch 28 January 1986 Presidential Commission - cause: O-rings not pliable in cold weather or holed in pressure test Thermal distress Data Plot proportions r/m vs temperature x1 and pressure x2 m=6 Statistical model, R binomial Bin(m,π), R=1,...,6 π = eu /(1+eu) u = β0 + β1 x1 + β2 x2
rj O-rings out of m with thermal distress at launch temperature xj Pr{distress} = π = eu /(1+eu) u = β0 + β1 x R ~ IBinomial (m,π), m = 6 L(β0 ,β1) = Pr{Rj = rj; β0 ,β1} Contour plot maximum at (β0 ,β1) approx (5,-0.1) ridge
Summaries. "key idea is that in many cases log likelihood is approx quadratic in the parameter" {More later} Example exponential samples of sizes 5, 10, 20, 40, 80 each sample has = exp{-1} the maximum of the log likelihood is at l() = -n (log + /n) l'( ) = 0 l"( ) = -n/ 2 maximum likelihood estimate,
Likelihood, L. L() = f(y;) in regarded as function of for fixed y "L will be relatively larger for near that which generated the data" When Y's i.i.d., y = (y1,...,yn) sample L() = f(y;) = f(yj;) l() = log L() = log f(yj;)
Maximum likelihood estimate likelihood equation. when things exist. score statistic/vector. observed information.
Local maximum? Computation and representation iterate to convergence
log RL() = l() - l( ) ( - )2l"( )/2 "In many cases the likelihood can be summarized in terms of the mle and the observed information -l"( ). " In a sense one can act as if the distribution is approximately normal There are large sample optimality results, but there are problems too, e.g. the uniform on (0,)
Observed information Fisher information I() = EJ()
Properties of U(), u() E(U()) = nE(u()), E(u()) = 0 Remember
Var U() = n Var u() Var u() = i()
0: true parameter value U(0), J(0) sums of i.i.d.'s LLN and CLT EU(0) = 0, Var(0) = I(0) = ni(0) EJ(0) = I(0) = ni(0) I(0)-1 J(0) 1 in probability I(0)-1/2 U(0) Z in distribution, as n Z ~ Np (0,Ip )
Approximate 100(1-2)% CI for real 0 CR for vector 0