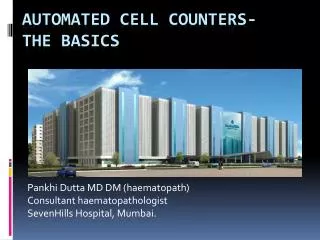
Automated Hematology Cell Counters
Automated Hematology Cell Counters. Practical Clinical Hematology. 10. Methodology.


Automated Hematology Cell Counters
E N D
Presentation Transcript
Automated Hematology Cell Counters Practical Clinical Hematology 10
Methodology • Current hematology analyzers use a combination of light scatter, electrical impedance, fluorescence, light absorption, and electrical conductivity methods to produce complete red blood cell, platelet, and leukocyte analyses. All the widely used automated instruments analyze cells in flow and are essentially highly specialized flow cytometers.
Principles • The Coulter Principle • Electrical Conductivity or Radiofrequency • Optical Scatter • Light Absorption • Fluorescence • VCS Technology (Volume, Conductivity, and Scatter) • Hydrodynamic Focusing: Both optical and impedance methods of cell counting employ hydrodynamic focusing (focused flow)
The Coulter Principle • Using this technology, cells are sized and counted by detecting and measuring changes in electrical resistance when a particle passes through a small aperture. This is called the electrical impedance principle of counting cells. • A blood sample is diluted in saline, a good conductor of electrical current, and the cells are pulled through an aperture by creating a vacuum. Two electrodes establish an electrical current. The external electrode is located in the blood cell suspension. The second electrode is the internal electrode and is located in the glass hollow tube, which contains the aperture.
Low-frequency electrical current is applied to the external electrode and the internal electrode. DC current is applied between the two electrodes. Electrical resistance or impedance occurs as the cells pass through the aperture causing a change in voltage. This change in voltage generates a pulse (Fig. ). The number of pulses is proportional to the number of cells counted. The size of the voltage pulse is also directly proportional to the volume or size of the cell.
This was the principal parameter used in earlier analyzers for characterizing all cell types, but it is now used primarily for counting and sizing red blood cells and platelets.
Instruments • The newer analyzers include white cell differential counts, relative or percent and absolute number, and reticulocyte analysis. • The differential may be a three-part differential that includes granulocytes, lymphocytes, and MID or a five-part differential that includes neutrophils, lymphocytes, monocytes, eosinophil's, and basophils. The new generation of analyzers now offers a sixth parameter, which is the enumeration of nucleated RBCs (nRBCs).
Instruments Automated full blood counters with a five-part or more differential counting capacity[*]
Performance • Whole blood is aspirated, diluted, and then divided into two samples. One sample is used to analyze the red blood cells and platelets while the second sample is used to analyze the white blood cells and hemoglobin. • Electrical impedance is used to count the white blood cells, red blood cells, and platelets as they pass through an aperture. As each cell is drawn through the aperture, a change in electrical resistance occurs generating a voltage pulse. The number of pulses during a cycle corresponds to the number of cells counted. • The amplitude of each pulse is directly proportional to the cell volume.
In the RBC chamber, both the RBCs and the platelets are counted and discriminated by electrical impedance Particles between 2 and 20 fL are counted as platelets, and those greater than 36 fL are counted as RBCs. • Lyse reagent is added to the diluted sample and used to count the white blood cells. The lysing reagent also cause WBC's membrane collapse around the nucleus, so the counter actually measuring the nuclear size. After the white blood cells have been counted and sized, the remainder of the lysed dilution is transferred to the Hgb Flow Cell to measure Hemoglobin concentration.
Hemoglobin Measurement • Using cyanide free Hb chemistry methods, rapid RBCs lysis followed by the formation of an imidazole-hemoglobin complex with an absorption peak at 540 nm. • The Cell-Dyn uses electronic sizing to determine a three part automated differential. The percentage and absolute counts are determined for lymphocytes, neutrophil, and mid-size population of monocytes, basophils, eosinophils, blasts, and other immature cells. • Results will be used to monitor patient’s cell counts and absolute neutrophil count and to determine if further chemotherapy should be administered.
Specimen Requirements • Whole blood collected in an EDTA tube. • Minimum sample volume is 0.5 mL using the Open Sample Mode. The instrument aspirates 30 μL of patient sample. • Samples are stable at room temperature for eight hours.
Overview of Analysis Modes ● Whole blood mode This is the mode of analyzing collected blood sample in the whole blood status. The tube cap is opened and the sample is aspirated through the sample probe one after another. ● Pre-diluted mode This mode is used in analyzing a minute amount of child’s blood, for instance, collected from the earlobe or fingertip. In this mode, blood sample diluted into 1:26 before analysis is used. The sample aspiration procedure is the same as in the whole blood mode.
Note: • In the pre-diluted mode, particle distribution curve and particle distribution analysis data are not output, and the output is confined to only the CBC 4 parameter (dependent parameter on MCV) but the remainder parameter multiply by dilution factor.
Sources of error • In cell count include: • Cold agglutinins - low red cell counts and high MCVs can be caused by a increased number of large red cells or red cell agglutinates. • If agglutinated red cells are present, the automated hematocrits and MCHCs are also incorrect. Cold agglutinins cause agglutination of the red cells as the blood cools. • Cold agglutinins can be present in a number of disease states, including infectious mononucleosis and mycoplasma pneumonia infections. • If red cell agglutinates are seen on the peripheral smear, warm the sample in a 37°C heating block and mix and test the sample while it is warm. Strong cold agglutinins may not disperse and need to be redrawn in a pre-warmed tube and kept at body temperature.
Fragmented or very microcytic red cells • These may cause red cell counts to be decreased and may flag the platelet count as the red cells become closer in size to the platelets and cause an abnormal platelet histogram. The population is visible at the left side of the red cell histogram and the right end of the platelet histogram.
Platelet clumps and platelet satellitosis: these cause falsely decreased platelet counts. Platelet clumps can be seen on the right side of the platelet histogram. Decreased platelet counts are confirmed by reviewing the peripheral smear. Always scan the edge of the smear when checking low platelet counts.
Giant platelets: these are platelets that approach or exceed the size of the red cells. They cause the right hand tail of the histogram to remain elevated and may be seen at the left of the red cell histogram.
Nucleated red blood cells: these interfere with the WBC on some instruments by being counted as white cells/lymphocytes .
In measuring hemoglobin include • Anything that will cause turbidity and interfere with a Spectrophotometry method. • Examples are a very high WBC or platelet count, lipemia and hemoglobin's that are resistant to lysis, such as hemoglobin's S and C.
Basic automated hematology analyzers provide an electronic measured • red cell count (RBC), • white cell count (WBC), • platelet count (Plt), • mean platelet volume (MPV), • hemoglobin concentration (Hb), • and the mean red cell volume (MCV).
From these measured quantities, the hematocrit (Hct), mean cell hemoglobin (MCH), mean cell hemoglobin concentration (MCHC), and the red cell distribution width (RDW) are calculated.
RED CELL INDICES • Hematocrit calculation • Hematocrit (Hct) or (PCV) is the volume of the red cells as compared to the volume of the whole blood sample. Hematocrits on the automated systems are calculated. • The volume of each red cell is measured as it is counted and a mean cell volume is derived. The calculations are not precisely the same. But, they can be summarized as mean corpuscular red cell volume (MCV) multiplied by the red cell count (RBC(. • Hematocrits are reported in L/L or the traditional %.
Sources of errors in Hct • Hematocrits calculated by automated instruments depend on correct red cell counts and red cell volumes to arrive at an accurate hematocrit. • Hence, anything affecting the red cell count or volume measurement will affect the hematocrit. • This method is not as sensitive to the ratio of blood to EDTA as the centrifuged hematocrit
Correlating Hemoglobin and Hematocrit Values • The hemoglobin times three roughly equals the hematocrit in most patients. • Example: 14.8 x 3 = 44 (patient's hematocrit result is 45 L/L) • 11.0 x 3 = 33 (patient's hematocrit result is 32 L/L) • The exception to this rule is in patients with hypochromic red cells. These patients will have hematocrits that are more than three times the hemoglobin
MCV The counter provides us with MCV which is derived from the histogram (sum of pulse height / sum of pulse). Not: 1 μL= 109fL • MCH is Mean Corpuscular Hemoglobin weight in picograms. This is the average weight of the hemoglobin in picograms in a red cell. It is a calculated value. • Not: 1g = 1012pg, 1L = 10 dL • MCH =hemoglobin in pg/L / red cell count in pilions/L • MCHC is Mean Corpuscular Hemoglobin Content. This indicates the average weight of hemoglobin as compared to the cell size. It is traditionally a calculated • MCHC = (Hemoglobin in g/dL / HCT) x 100
RDW: The RDW (red cell distribution width) is a measurement of the width of the bases of the RBC histogram the red cell size distribution and is expressed as the coefficient of variation percentage. • The RDW is increased in treated iron deficiency, vitamin B12 deficiency, folic acid deficiency, post-transfusion. • MPV: The MPV is a measure of the average volume of platelets in a sample and is analogous to the erythrocytic MCV. • Pct: (plateletcrit) analogues to HCT for RBCs
How Data Are Reported • In most automated systems, the complete blood count is numerically reported.. • The differential is numerically recorded and then graphically displayed
RBC and Platelet Histograms The black line represents normal cell distribution. The red line on the RBC histogram graphically represents a Microcytic red cell population.
Red Cells Histogram • normal red cell histogram displays cells form (36- 360 ) fl • (24- 36 fl ) flag may be due1- RBCs fragments2- WBC's fragments 3- Giant plts4- Microcyte • Shift to right :- Leukemia- Macrocytic anemia - Megaloblastic anemia • Shift to left :- Microcytic anemia (IDA) • Bimodal- Cold agglutinin- IDA, Megaloblastic anemia with transfusion.-Sideroblastic anemia. • Trimodal- Anemia with transfusion
Plts histogram • Normal platelet histogram displays cells from (2-20 fl). • (0-2) • Air Babbles • Dust • Electronic and Electricalnoise • Over 20 fL • Microcyte • Scishtocyte • WBC's fragments • Giant Plts • Clumped plts
LEUKOCYTE HISTOGRAM ANALYSIS • The histogram is a representation of the sizing of the leukocytes. The differentiation is as follows:
The following table lists the region (R) flags and the abnormalities they may represent:
Interferences That May Cause Erroneous Results • WBC • Unusual RBC abnormalities that resist lysis • Nucleated RBCs • Fragmented WBCs • Unlysed particles greater than 35 fL • Very large or aggregated plts • Specimens containing fibrin, cell fragments or other debris (esp pediatric/oncology specimens • RBC • Very high WBC (greater than 99.9) • High concentration of very large platelets • Agglutinated RBCs, rouleaux will break up when Istoton is added • RBCs smaller than 36 fL • Specimens containing fibrin, cell fragments or other debris (esp • pediatric/oncology specimens
Interferences That May Cause Erroneous Results • Hgb • Very high WBC count • Severe lipemia • Heparin • Certain unusual RBC abnormalities that resist lysing • Anything that increases the turbidity of the sample such as elevated • levels of triglycerides • High bilirubin • MCV • Very high WBC count • High concentration of very large platelets • Agglutinated RBCs • RBC fragments that fall below the 36 fL threshold • Rigid RBCs