Download

1 / 58
1.02k likes | 1.98k Vues
Chapter-06 quantitative techniques for planning and decision making . Dr. Gehan Shanmuganathan , (DBA). Caterpillar Inc. Caterpillar Inc. Managed raw materials based on quantitative techniques Minimum order quantity management Demand management . Chapter objectives . 6.1.

E N D
Chapter-06quantitative techniques for planning and decision making Dr. GehanShanmuganathan, (DBA)
Caterpillar Inc.. • Managed raw materials based on quantitative techniques • Minimum order quantity management • Demand management
6.1 Learning Objectives 1 Explain how managers use data-based decision making 2 Explain the use of forecasting techniques in planning. 3 Describe how to use Gantt charts, milestone charts, and PERT planning techniques. 4 Describe how to use break-even analysis and decision trees for problem solving and decision making. 5 Describe how to manage inventory by using materials requirement planning (MRP), the economic order quantity (EOQ), and just-in-time (JIT) techniques. 6Describe how to identify problems using a Pareto diagram
Data- based decision making • Data-Driven Management (DDM) • An attitude and approach to management rather than a specific technique that stems from data-based decision making
Where managers use data-based decision making? • How much to invest? • Buy or make decisions? • Market size, demand, and potential? • Number of employees needed? • Sales targets? • Quality controls? • Cost controls? • Best employees?
Forecasting methods • Judgmental Forecasting (usually bottom-up) • A qualitative forecasting method based on a collection of subjective opinions • Time-Series Analysis (usually top- down) • An analysis of a sequence of observations (historical data) that have taken place at regular intervals over a period of time (hourly, weekly, monthly, and so forth) • Moving average and exponential smoothing
Annual Sales 100 Forecasted Data 75 50 25 0 1990 1992 1994 1996 1998 2000 2002 2004 2006 7.2 Types of Forecasting Methods Qualitative A prediction based on a collection of subjective hunches. Quantitative A prediction based on historical data or models, such as a time-series analysis. Adapted from Exhibit 7.2
Errors and traps making forecasts or estimates • Over confidence • Prudence “to be on the safe side” • Credibility of the past figures used • Moving average will not take other factors (customers, competitors, and suppliers) into consideration but the given figures to extrapolate
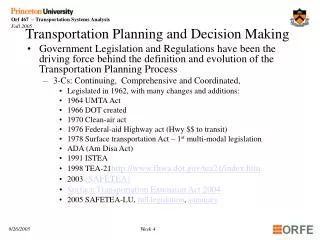
Types of forecasts • Economic forecasting – GDP, GNP, per capita income, consumer confidence, inflation, unemployment • Sales forecasting- weekly, monthly, annual, geographically, per salesman, per brand • Technological forecasting – number of users, computer literacy, use of e-commerce
Scenario planning • The process of preparing responses to predicted changes in conditions • What the future might look like • Worse and Best case scenario
The Delphi Technique for increasing the Accuracy of Forecasts
The Delphi Technique • A form of group decision making designed to provide group members with one another’s idea and feedback while avoiding some of the problems associated with interacting groups • Includes series of decision making sessions until they reach the final decision as pre-determined
Gantt charts- Henry Gantt (scientific management) • A chart that depicts the planned and actual progress of work during the life of the project
Gantt Chart: Opening a Nightclub Production Activities Jun Jul Aug Sep Oct Nov Dec Jan 01. Locate site 02. Get liquor license 03. Hire contractors for renovation 04. Supervise renovation 05. Hire lighting contractor 06. Supervise lighting installation 07. Begin advertising of club 08. Hire club employees 09. Get booking agent for nightclub talent Scheduled Completed 10. Open for business 30 Nov
Milestone charts • An extension of the Gantt chart that provides a listing of the sub-activities that must be completed to accomplish the major activities listed on the vertical axis
7.4 Milestone Chart: Opening a Nightclub Production Activities Jun Jul Aug Sep Oct Nov Dec Jan 01. Locate site 1 2 3 02. Get liquor license 4 4 5 6 7 8 9 10 03. Hire contractors for renovation 11 12 13 04. Supervise renovation 14 15 16 17 18 19 05. Hire lighting contractor 20 21 06. Supervise lighting installation 22 23 24 07. Begin advertising of club 25 26 08. Hire club employees 27 28 29 30 09. Get booking agent for nightclub talent 31 32 10. Open for business 33 Milestones to be Accomplished 27. Speak to friends and acquaintances about job openings 28. Put ad in local newspapers 29. Conduct interviews with applicants and check references of best candidates 30. Make job offers to best candidates Adapted from Exhibit 7.5 33. Have grand-opening celebration 5 January
Program Evaluation and Review Technique (PERT) • A network model used track the planning activities required to complete a large-scale, non-repetitive project. It depicts all of the interrelated events that must take place
Event Activity Estimated Time in Weeks Preceding Event A Locate site 5 None B Get liquor license 30 A C Hire renovation contractors 13 A D Supervise renovation 30 C E Hire lighting installation 6 D F Supervise lighting installation 13 E G Begin advertising club 8 B, F H Hire club employees 14 G I Get booking agent 8 G, H J Open club for business 1 I = Critical Path (thick arrow) 7.5 PERT Network: Opening a Nightclub Adapted from Exhibit 7.6
14 8 30 H G B 5 1 8 8 I Start A J 8 13 30 13 F C 6 E D 7.6 PERT Network: Opening a Nightclub (continued) Adapted from Exhibit 7.6
Example • A,B are two activities, B cannot start until A is finished. A takes 5 days and B takes 7 days 3 2 1 A B 5 days 7 days
Example -2 • B,C and D cannot start until A is completed 3 B 4 C 1 2 A D 5
Steps involved in preparing PERT network • Prepare a list of all activities and events necessary to complete the project • Design the actual PERT network, relating all the activities to each other in the proper sequence • Estimate the time required to complete each activity
“Time” in PERT • Expected Time- the time that will be used on the PERT diagram as the needed period for the completion of an activity • Critical Path- the path through the PERT network that includes the most time-consuming sequence of events and activities • Optimistic Time (O)- the shortest time an activity will take if everything goes well • Pessimistic Time (P)- the amount of time an activity will take if everything goes wrong • Most Probable Time (M)- the most realistic estimate of how much time an activity will take
Critical path 8 30 10 E B 3 6 H 24 A 16 C F 70 0 5 9 60 40 24 10 20 9 16 4 7 8 0 5 5 D G 5 10 5 50 11
Break-even analysis • A method of determining the relationship between total cost and total revenues at various levels of production or sales activity • No cost- no profit point
Revenues and costs ($ in thousands) 80 Revenues 70 Break-Even Point 60 Profit Total Costs 50 40 Variable Costs Loss 30 Fixed Costs 20 Sales (units in hundreds) 10 0 10 20 30 40 50 60 70 80 90 100 7.7 Break-Even Chart: Adding a New Product Adapted from Exhibit 7.7
Break-even formula- Units FC BE = _____________________ Unit Selling Price- Unit Variable Cost $ 300,000 BE = _____________________ = 600 Units $ 1,000 - $ 500
Decision trees • Decision Tree- A graphic illustration of the alternative solutions available to solve a problem • Expected value- the average return on a particular decision being made a large number of times
7.8 First-Year Decision Tree for Nightclub Owner Possible Alternatives States of Nature Conditional Values Expected Values $100,000 Good season (0.6) Nightclub only $90,000 Poor season (0.4) -$10,000 Decision Point $150,000 Nightclub and dinner restaurant Good season (0.6) $120,000 Poor season (0.4) -$30,000
Material-Requirement Planning (MRP) A system designed to ensure that materials handling and inventory control are efficient. Economic-Order Quantity (EOQ) The inventory level that minimizes both administrative and carrying costs. Just-in-Time (JIT) A system designed to minimize inventory and move it into the plant exactly when needed. 7.9 Inventory Control Techniques
Economic order quantity (EOQ) • The inventory level that minimizes both administrative costs and carrying costs
Just-In-Time System (JIT) • A system to minimize inventory and move it into the plant exactly when needed • This is a demand driven pull strategy used at the manufacturing facility • Short production lead time • High inventory turnover