Download
1 / 13
130 likes | 205 Vues
This methodology involves stacking Landsat bands, deleting land and clouds, running enhancement techniques, and extracting suspended sediment for detailed image analysis. It includes supervised classification for accurate results.

E N D
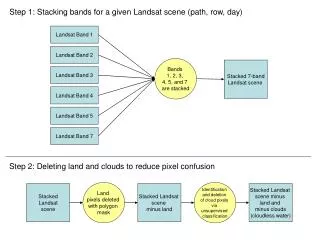
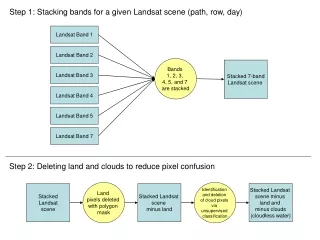
Step 1: Stacking bands for a given Landsat scene (path, row, day) Landsat Band 1 Landsat Band 2 Bands 1, 2, 3, 4, 5, and 7 are stacked Stacked 7-band Landsat scene Landsat Band 3 Landsat Band 4 Landsat Band 5 Landsat Band 7 Step 2: Deleting land and clouds to reduce pixel confusion Land pixels deleted with polygon mask Identification and deletion of cloud pixels via unsupervised classification Stacked Landsat scene Stacked Landsat scene minus land Stacked Landsat scene minus land and minus clouds (cloudless water)
Step 3: Running and comparing enhancement techniques Band ratio B3/B1 Stacked 7-band cloudless water pixels Output grid of B3/B1 Good output. Save Output grid of B3/B1 Band ratio B2/B1 Stacked 7-band cloudless water pixels Output grid of B2/B1 Good output. Save Output grid of B2/B1 Visual comparison of enhancement techniques Clay enhancement Stacked 7-band cloudless water pixels Output grid of clay enhancement Good output. save clay enhancement grid Iron oxide enhancement Stacked 7-band cloudless water pixels Output grid of Iron oxide enhancement
Step 4: Extraction of suspended sediment from enhancements Extraction of suspended sediment pixels based on high pixel values Grid of pixels representing varying intensities of suspended sediment for B3/B1 Output grid of B3/B1 Suspended sediment pixels mosaicked Grid of combined suspended sediment from enhancements Extraction of suspended sediment pixels based on high pixel values Output grid of B2/B1 Grid of pixels representing varying intensities of suspended sediment for B2/B1 Extraction of suspended sediment pixels based on high pixel values Output grid of clay enhancement Grid of pixels representing varying intensities of suspended sediment for clay enhancement
Step 5: Supervised classification (performed twice – once for the western side and once for the eastern side of the image due to pixel confusion from sunglint) Supervised classification of western side of image Extraction of suspended sediment pixels in western side of image Stacked 7-band cloudless water pixels Supervised grid with classes representing suspended sediment, clear water, and cloud fringes Grid of pixels representing varying intensities of suspended sediment in western part of image Supervised classification of eastern side of image Extraction of suspended sediment pixels in eastern side of image Stacked 7-band cloudless water pixels Supervised grid with classes representing suspended sediment, clear water, and cloud fringes Grid of pixels representing varying intensities of suspended sediment in eastern part of image
Step 6: Final products (metadata was also written to accompany the final image) Grid of combined suspended sediment from enhancements Suspended sediment pixels mosaicked Clean-up of error pixels (mainly cloud pixels and image edges) Grid of combined suspended sediment pixels Final image of the Landsat scene enhanced to show suspended sediment Grid of pixels representing varying intensities of suspended sediment in western part of image Grid of pixels representing varying intensities of suspended sediment in eastern part of image
GSA Product Methodology Flow Chart Traditional enhancements applied All bands combined to make a stacked image Original Landsat bands downloaded from ITSC ftp site Clouds and land removed Results combined and edited Supervised classification FGDC metadata produced for final image Final image showing enhanced suspended sediment Final image, metadata, and original stacked image uploaded to ITSC ftp site
GSA Product Methodology Flow Chart Traditional enhancements applied All bands combined to make a stacked image Original Landsat bands downloaded from ITSC ftp site Clouds and land removed Results combined and edited Supervised classification FGDC metadata produced for final image Final image showing enhanced suspended sediment Final image, metadata, and original stacked image uploaded to ITSC ftp site
GSA Product Methodology Flow Chart Traditional enhancements applied All bands combined to make a stacked image Original Landsat bands downloaded from ITSC ftp site Clouds and land removed Results combined and edited Supervised classification FGDC metadata produced for final image Final image showing enhanced suspended sediment Final image, metadata, and original stacked image uploaded to ITSC ftp site
GSA Product Methodology Flow Chart Traditional enhancements applied All bands combined to make a stacked image Original Landsat bands downloaded from ITSC ftp site Clouds and land removed Results combined and edited Supervised classification FGDC metadata produced for final image Final image showing enhanced suspended sediment Final image, metadata, and original stacked image uploaded to ITSC ftp site
GSA Product Methodology Flow Chart Traditional enhancements applied All bands combined to make a stacked image Original Landsat bands downloaded from ITSC ftp site Clouds and land removed Results combined and edited Supervised classification FGDC metadata produced for final image Final image showing enhanced suspended sediment Final image, metadata, and original stacked image uploaded to ITSC ftp site
GSA Product Methodology Flow Chart Traditional enhancements applied All bands combined to make a stacked image Original Landsat bands downloaded from ITSC ftp site Clouds and land removed Results combined and edited Supervised classification FGDC metadata produced for final image Final image showing enhanced suspended sediment Final image, metadata, and original stacked image uploaded to ITSC ftp site
GSA Product Methodology Flow Chart Traditional enhancements applied All bands combined to make a stacked image Original Landsat bands downloaded from ITSC ftp site Clouds and land removed Results combined and edited Supervised classification FGDC metadata produced for final image Final image showing enhanced suspended sediment Final image, metadata, and original stacked image uploaded to ITSC ftp site
Final Step: Visual inspection and documentation of features discovered in enhancement and processing of imagery Southeasterly pointing wisps of suspended sediment showing normal (pre-Arlene) sediment transport patterns. These wisps correlate with sand ridges on the seafloor. Oil sheen off shore of Louisiana two days after Katrina. This oil was washed out from the oil spills onland. Patterns of the sheen help indicate flow and transport direction.