Landsat
Landsat. GEO 410 Remote Sensing. History. 1965, director of USGS, proposed idea of remote sensing satellite program to gather data about natural resources of planet. Conceived largely as a direct result of the early Mercury photography of Earth.

Landsat
E N D
Presentation Transcript
Landsat GEO 410 Remote Sensing
History • 1965, director of USGS, proposed idea of remote sensing satellite program to gather data about natural resources of planet. • Conceived largely as a direct result of the early Mercury photography of Earth.
Weather satellites monitoring atmosphere were considered useful, but no appreciation of terrain data until mid-1960s. • When Landsat 1 was proposed, it was met with intense opposition. • DoD feared a civilian program like Landsat would compromise secrecy of reconnaissance missions.
1965 - NASA began R.S. of Earth using sensors on planes. • 1966 - USGS convinced Secretary of the Interior (Stewart Udall) to announce that Dept. of the Interior (DOI) was going to proceed with Earth-observing satellite program. • This political stunt coerced NASA to expedite the building of Landsat. • But, budgetary constraints and sensor disagreements between agencies (Dept. of Agriculture and DOI) held up satellite construction. • Finally, 1970, NASA had green light to build satellite. • Within only two years, Landsat 1 was launched, heralding a new age of remote sensing of land from space.
1975, NASA Administrator predicted that if one space age development would save the world, it would be Landsat and its successor satellites. • Since the early 1970s, Landsat has continuously and consistently archived images of Earth • data archive gives scientist the ability to assess changes in Earth’s landscape. • ~40 years - Landsat has collected spectral information from Earth’s surface, creating a historical archive unmatched in quality, detail, coverage, and length.
“It was the granddaddy of them all, as far as starting the trend of repetitive, calibrated observations of the Earth at a spatial resolution where one can detect humankind’s interaction with the environment” • Landsat sensors have moderate spatial-resolution. • Can’t see individual houses, but you can see large objects such as forests or highways. • important because it is coarse enough for global coverage, yet detailed enough to characterize human-scale processes such as urban growth.
Landsat Program • Joint effort of • USGS • NASA • Purpose - Gather Earth resource data using series of satellites. • repetitive acquisition of observations • land masses, coastal boundaries, coral reefs • NASA -responsible for developing and launching spacecrafts. • USGS -responsible for flight operations, maintenance, data processing/archiving, product generation, and distribution.
1972 – Landsat 1 launched • 1999 – Launch of Landsat 7 • ~40 years of data - longest continuous record of the earth's surfaces. • Critical to land surface monitoring and global change research. • No other eos matches Landsat's combination of synoptic coverage, spatial and spectral resolution.
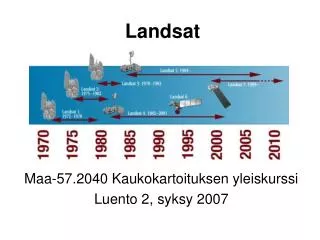
Landsat 1: MSS 1972–1978 Landsat 2: MSS 1975–1982 Landsat 3: MSS 1978–1983 added thermal band but it failed Landsat 4: MSS, TM (7 bands) 1982–2001* data downlink failed in 1993 Landsat 5: MSS, TM 1984–2012 (28 years, 10 months) Landsat 6: MSS, ETM failed launch, 1993 Landsat 7: ETM+ 1999–still operational Landsat 8: ETM+ Launch Feb. 11 2013
Landsat-1 & 2 Objective: To demonstrate the usefulness of remote sensing data for land and resource applications. Design life of one year.
Multispectral Scanner • Measured reflected energy in 4 spectral bands. • Landsat 3 - MSS sensor with additional band in thermal (heat) infrared radiation.
Photo: Thematic Mapper (TM), second-generation sensor for monitoring Earth's resources. Landsat 4, 5, & 7
Sensors • MSS and TM sensors primarily detect reflected radiation from Earth's surface in vis and IR. • But the TM sensor with its seven spectral bands provides more radiometric information than the MSS sensor.
Sensors • Sensors have evolved – MSS, TM, Enhanced Thematic Mapper Plus (ETM+) • Primary new features on Landsat 7 are addition of band 8: • panchromatic band with 15m spatial resolution • Panchromatic: sensitive to all or most of the visible spectrum. • thermal IR channel with 60m spatial resolution
panchromatic band 8 covers 0.52-0.92 µm • extends over band 2 (0.525-0.605 µm), band 3 (0.630-0.690 µm) and band 4 (0.750-0.900 µm). • Pixel size 15 m • Used for high-spatial-resolution analysis.
Landsat 7 and TM & ETM+ Characteristics: Band Spectral Range(µm) Resolution(m) 1 .45 to .51 30 2 .525 to .605 30 • .63 to .690 30 • .75 to .90 30 • 1.55 to 1.75 30 7 2.09 to 2.35 30 • 10.40 to 12.5 60 8 .52 to .90 15
Landsat Data Continuity Mission – 2013landsat.usgs.gov/L8_band_combos.php – compare Landsat 7 to Landsat 8
Landsat 1: MSS 1972–1978 Landsat 2: MSS 1975–1982 Landsat 3: MSS 1978–1983 added thermal band but it failed Landsat 4: MSS, TM (7 bands) 1982–2001* data downlink failed in 1993 Landsat 5: MSS, TM 1984–2012 (28 years, 10 months) Landsat 6: MSS, ETM failed launch, 1993 Landsat 7: ETM+ 1999–still operational Landsat 8: ETM+ Launch Feb. 11 2013
Near Polar/Sun-synchronous orbits Repeat coverage interval: 16 days (233 orbits)
Ground System • Capable of capturing and processing 250 Landsat scenes and delivering 100 scenes to users each day.
Benefits Mission Continuity: Landsat 7 - latest in long history of land remote sensing spacecraft, spanning 40 years of multispectral imaging. Global Mission: data acquired systematically to build and periodically refresh a global archive of sun-lit, substantially cloud-free images of the Earth's landmass.
Benefits Earth's landmass imaged every 16 days - using a planning scenario that emphasizes seasonal changes in vegetation and uses cloud predictions from the National Weather Service to avoid imaging cloudy areas, thus optimizing the data acquisition strategy.
Benefits Affordable Data Products: Landsat products available from the EROS Data Center for free.
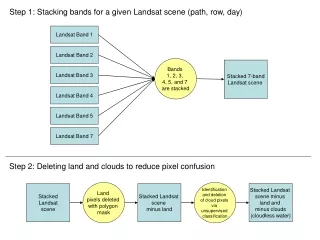
Color Composites in Landsat TM Data • Three-band composites created using the measured reflected energy three spectral bands. • The way in which the bands are mapped to the three colors in the output image depends on what information is desired to be highlighted in the image. • For some applications, desirable for landcover classes to be associated with familiar colors, e.g., grass is green. • In other cases, contrasting colors are preferred to highlight objects of interest from the background.
Color Composites in Landsat TM Data True-Color Composite (3,2,1) • approximates range of vision for human eye • images appear as we would expect to see in photograph. • low in contrast, somewhat hazy - blue light more susceptible to scattering by atmosphere. • Broad-based analysis of underwater features and landcover are applications for true-color composites.
Band 3 (Visible red) = red • Band 2 (Visible green) = green • Band 1 (Visible blue-green) = blue
Color Composites in Landsat TM Data Near Infrared Composite (4,3,2) • Add near infrared (NIR) band and drop visible blue band. • Vegetation in the NIR band is highly reflective • NIR composite vividly shows vegetation in various shades of red. • Water appears dark, almost black, due to the absorption of energy in the visible red and NIR bands.
Band 4 (NIR) = red Band 3 (Visible red) = green Band 2 (Visible green) = blue
Color Composites in Landsat TM Data • Shortwave Infrared Composite (7,4,3 or 7,4,2) • contains at least one shortwave infrared (SWIR) band. • Reflectance in the SWIR region is due primarily to moisture content. • SWIR bands are especially suited for change detection, disturbed soils, soil type, and vegetation stress.
Band 7 (SWIR) = red • Band 4 (NIR) = green • Band 3 (red) = blue Or... • Band 7 (SWIR) = red • Band 4 (NIR) = green • Band 2 (green) = blue vegetation - shades of green. Bare soils and clearcut areas - purplish or magenta. bright red area is an active fire. smoke plume originating from active fire site appears faint bluish.
Station Fire - August 30, 2009 - 140,000 acres burned in Angeles National Forest - Mt. Wilson Observatory threatened. Blue and white haze is smoke, pinkish areas have been burned, active fires appear bright red. Landsat-7 ETM+ Striping caused by failure of scan line corrector in 2003, introduced major striping in ETM+ imagery.
Landsat 5 image - Esperanza Fire in San Bernardino National Forest, Oct. 26, 2006. The fire caused a huge smoke plume; reaching ~3.0 miles high. Large image is a natural-color composite, small inset is false-color composite. The active fire fronts in the false-color image appear bright yellow.
Two false-color Landsat 5 images (1984 and 2009). ]dark purple grid of city streets and green of irrigated vegetation.Images were created using reflected light from the shortwave infrared, near-infrared and green portions of the electromagnetic spectrum (Landsat 5 TM bands 7,4,2)
Venice - Landsat 7 - 2001. pan-sharpened false-color composite of ETM+ bands 7, 5, and 3. Venice can be found on Landsat WRS-2 Path 192 Row 28.
Climate Change - Lake Chad borders Chad, Niger, Nigeria, and Cameroon, as well as on a natural border, the Sahel: a grassland which divides the Sahara Desert to the north and the more humid savannah to the south. Because Lake Chad is a shallow lake, depths of 16 - 26 feet, its surface area fluctuates markedly with changes in climate.
Wisconsin tornado damage - Landsat 2007. natural-color image.