Download

1 / 25
250 likes | 343 Vues
Explore the sources and reductions of contaminants impacting Lake Tahoe's clarity through the Clarity Model. Understand the necessary reductions to achieve desired conditions and the history of the model's development. Dive into the input variables, sensitivity analyses, and conclusions drawn from the model. Stakeholders can utilize the model to test various load reduction scenarios and make informed decisions for Lake Tahoe's preservation.

E N D
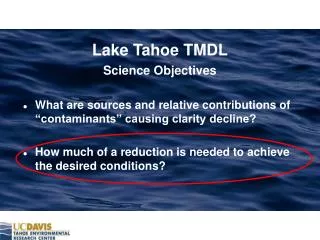
Lake Tahoe TMDL Science Objectives • What are sources and relative contributions of “contaminants” causing clarity decline? • How much of a reduction is needed to achieve the desired conditions?
Lake Clarity Model & What Makes Us Think It’s Right OR
The Clarity Model History 1978 – DYRESM 1996 – DLM-WQ 1997 – INAUGURAL TAHOE SUMMIT EPA WATERSHED GRANT 2000 – FIRST PARTICLE SIZE DATA 2002 – TMDL SCIENCE PROGRAM FUNDED MODELING/SCIENCE 2004 – CLARITY MODEL PEER REVIEW 2006 – REFINEMENT/CALIBRATION/VALIDATION 2007 – COMMENCING USE OF “FINAL” MODEL
CLARITY MODEL • A PROCESS-BASED NUMERICAL MODEL • SEVERAL MODELS COMBINED INTO ONE: • - HYDRODYNAMIC/THERMODYNAMIC MODEL • WATER QUALITY (ECOLOGICAL) MODEL • PARTICLE FATE MODEL • OPTICAL MODEL • IN ADDITION, IT HAS “INPUTS” FROM OTHER MODELS • WATERSHED MODEL • METEOROLOGY MODEL • ATMOSPHERIC MODEL
Atmospheric Atmospheric Land Use Land Use Deposition Deposition Secchi Depth Inorganic Algal Lake Tributaries Tributaries Light Scattering & Absorption Particles Growth N, P Climate, Climate, Groundwater Loss Loss Particle Fate Model Optical Model Ecological Model Precipitation Precipitation DLM Hydrodynamic/Thermodynamic Model Lake Tahoe Clarity Model
INPUT VARIABLES CLIMATE BATHYMETRY INFLOW – Q, N, P, PSD OUTFLOW ATMOSPHERIC – N, P, PSD GROUNDWATER – Q, N, P
SECCHI DEPTH STRATIFICATION & MIXING PARTICLE DYNAMICS ALGAL GROWTH NUTRIENT CYCLING LIGHT ABSORPTION(i) SCATTERING (i) Clarity Model
Base Case Do Nothing More in an Unchanging World
Test Case 1 – 55% Load Reduction All Sources, All loads, 20 year Phase-in
Combined Results All Sources, All loads, 20 year Phase-in FINES, N, P N, P ONLY
Test Case 2 – 75% Load Reduction Urban Sources, All loads, 20 year Phase-in
Combined Results Urban Sources, All loads, 20 year Phase-in
Sensitivity Analysis Loads Particle load has largest impact on secchi depth 0.5X = half TMDL estimate 2X = double TMDL estimate
Sensitivity Analysis Model Parameters Algal growth rate Coagulation rate Light scattering (b*) Secchi Depth Secchi Depth Secchi Depth
Sensitivity Analysis Model Parameters L-L-H Light scattering Coagulation rate Algal growth rate COV = MEAN/SD = 11% L = 0.75X 0 = X H = 1.25X coagulation rate - light scattering – algal growth rate
WHAT MAKES US THINK THE MODEL IS CORRECT?
3 m in 2 years LOOK AT THE RECORD
Secchi Depth (m) Particles per ml STILL NOT CONVINCED?
There are a multitude of ways to achieve a specific clarity target Parameters are for illustrative purposes only % Nitrogen Reduction 100 90 80 70 60 50 40 30 20 10 0 0 10 20 30 % Sediment Reduction 40 50 60 70 80 90 Final Secchi Depth (m) 100 0 20 - 25………Red 10 20 - 25………Red 20 30 40 25.5 - 28…….Yellow 25.5 - 28…….Yellow 50 60 70 80 % Phosphorus Reduction 28.5 - 32.5…..Blue 28.5 - 32.5…..Blue 90 100 33 & above..Purple 33 & above..Purple
CONCLUSIONS • Process-based model – allows examination of the entire range of management, climate, disaster, growth etc. scenarios • Built on an established and peer reviewed framework • Particles dominate midlake clarity (nutrients secondary) – confirmed by data • Urban areas dominant source of particles – confirmed by data • Model results insensitive to uncertainties • Model predicted level of pollutant load reduction to achieve clarity target is confirmed by data • There are countless ways in which the desired load reductions can be achieved. The model can test them. The stakeholders must decide.
July 2006 Pathways Forum Received “Preliminary” Model Results Today there are different results – based on “Final” Model Results