Download
1 / 64
640 likes | 813 Vues
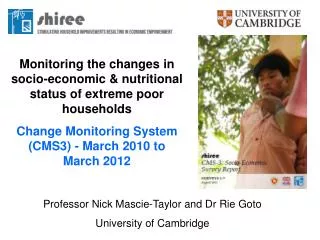
Monitoring the changes in socio-economic & nutritional status of extreme poor households Change Monitoring System (CMS3) - March 2010 to March 2012. Professor Nick Mascie-Taylor and Dr Rie Goto University of Cambridge. shiree Change Monitoring System (CMS).

E N D
Monitoring the changes in socio-economic & nutritional status of extreme poor households Change Monitoring System (CMS3) - March 2010 to March 2012 Professor Nick Mascie-Taylor and Dr Rie Goto University of Cambridge
shiree Change Monitoring System (CMS) Shiree has robust survey, monitoring and evaluation structure + CMS6
shiree Change Monitoring System (CMS) Shiree has robust survey, monitoring and evaluation structure
6 NGOs in Round One Phase One Scale Fund Three additional Round 2 Scale Fund NGOs (Concern, Oxfam, Caritas) commenced work in 2012 and will be analysed in future reports.
CARE: Gaibandha, Nilphamari, Rangpur, Lalmonirhat PAB: Gaibandha, Nilphamari, Rangpur, Lalmonirhat NETZ: Rajshahi, Naogaon, Chapai-Nawabgonj DSK: Dhaka slums (Karail, Kamrangichar) Uttaran: Satkira, Khulna SCF: Khulna, Bagerhat
Design of annual panel nutrition surveys Cohort 1 - 384 households (64 HHs from Phase One 6 NGOs) Cohort 2 - additional cohort from urban slum (DSK) and Adivashi (NETZ) in 2011 Cohort 3 - adding 3 NGOs in Phase Two in 2012 (including 10% estimated attrition each year) Within subject change Comparing with additional cohort Follow-up Testing for recruitment homogeneity CMS3 surveys conducted 3 times a year in March, July and October/November between March 2010 and 2012 and annual nutrition survey conducted each year in March.
CMS3 Round 7 - Annual nutrition and socio-economic surveys in 2012 26 February-16 April 2012 (total 50 days including 12 days training) It was a combined survey with Innovation Fund Round 1&2 Endline survey covering 25 Districts in Bangladesh covering 1472 HHs CMS3 annual nutrition survey covered: Cohorts 1&2 – 512 HHs Cohort 3 – 128 HHs
Total 45 research members including international nutrition advisor (Cambridge University), shiree staff, NGO Research Assistants, enumerators and measurers Training of enumerating and anthropometric measurement and performing careful quality control
Measurements • Nutritional status • Anthropometric indicators: weight, length/height –BMI (adults) and z-scores(child below 5 years of age) • Biochemical indicators: haemoglobin using HemoCue (portable analyser)
Socio-economic questionnaire • Socio-demographic characteristics of the household (including age, marital status, household/family size, education, disability, and occupation) • Morbidity report • Household and homestead land ownership • House condition (size, structure, source of drinking water, electricity and toilet facilities) • Cash loans and savings • Assets – animals, working equipment and belongings • Income – cash and in-kind • Expenditure – covering food, household and work related • Food intake and food security
Results Sample attrition for analyses Number of households which completed information all through surveys from March 2010
In total 303 households participated in the seven surveys from the initial sample of 384 households, an attrition rate of 21% between surveys 1 and 7. There was greater attrition in the urban sample (45%) than in the rural areas (16%). In total 303 households, information was collected on 1111 individuals of whom 634 were adults, 315 children aged between 5 and 15 years and 162 children under 5 years of age.
Male and female headed households and family size In the total sample 40.3% of households were female headed (FHHs). Mainly widowed (62.3%) and divorced/abandoned (23.0%). Mean family size increased significantly from 3.35 in survey 1 to 3.67 in survey 7. FHHs were smaller by, on average, 1.3 family members (4.2 vs 2.9). Schooling Only 25.0% of heads of households had attended school significantly more so in male (MHHs, 35.3%) than FHHs (12.1%). Between surveys 1 and 4 school attendance in children increased significantly from about 76% to 86% and rose to 89% in survey 7.
Chronic illness Chronic illness fell significantly between surveys 1 (15.6%) and 4 (4.2%) but there was no change between surveys 4 and 7 (4.8%).
Morbidity status The health status of family members was determined on the day of the survey and over the previous 7 and 30 days. Morbidity status (%) of all family member in the previous 30 days All adults: fever, cough, eye and skin infections fell between surveys 1, 4 and 7 while passing of worms fell between surveys 1 and 4 only. In children 5 to 15 years of age: the prevalence of fever and cough both fell between surveys 1 and 4 but not between surveys 4 and 7. Under 5 year old children: there were reductions in fever and cough and passing of worms. 1&7 All <0.001
Employment MHHs - Petty trading increased FHHs - Decreased unemployment and domestic maid, but begging still remained an important source of income (9.6%).
The number of days worked fell significantly between surveys 4 and 7 while advanced sale of labour generally fell. Between surveys 4 and 7 self employment increased by 10% and self employed worked, on average, significantly more days. Mean number of days and hours worked by head of household NB: Red shows significant difference (at least <0.01) between survey 4 and 7
Land ownership Households owning land increased significantly from 15.2% in survey 1 to 31.4% in survey 7 MHHs - The increase in ownership occurred between surveys 1 and 4 FHHs - ownership increased across all surveys. Land ownership by head of household
Household ownership, size and structure Owning house: The percentage of households owning their own house increased significantly from 72.6% to 80.2% between surveys 1 and 4 and fell slightly to 78.5% in survey 7.
House size: mean reported size of houses increased from 14.0 square metres in survey 1 to 15.5 square metres in survey 4 and to 16.2 square metres in survey 7, but the increase was only significant in MHHs. The smallest dwellings were in the urban slums (mean 10 square metres). By male and female headed household By NGOs House material: There was no significant change in materials used in house construction over this time period; walls were primarily made of grass etc, mud or tin sheet, roofs of tin sheet and floors of mud.
Electricity, water supply and defecation practices Electricity: There was no significant change in electricity or water supply between surveys. In rural areas about 95% of households had no electricity supply whereas 85% of urban dwellers had access to electricity. Water: Nearly all urban households obtained their water from a piped supply or tubewell while over 80% of rural households obtained their water from a tubewell. Defecation: There was a highly significant reduction in open defecation in rural areas down from 36.9% in survey 1, to 19.8% in survey 4 and 15.3% in survey 7 and concomitant increase in use of ring/slab/sanitary latrine up from 49.6% in survey 1 to 78.4% in survey 7.
Loans and cash savings Loans: There was no consistent pattern to either the number or amount of loans over the seven surveys. NB: Five sources of cash loan were identified (i) free informal (ii) informal loans with interest (iii) interest loans from samity (iv) interest loans from microfinance institutions and (v) interest loans from a bank or the Government of Bangladesh.
Cash savings: In survey 1, 36% of households had some cash savings increasing to 84% in survey 4 and falling to 81% in survey 7. The mean amount increased significantly from 489 Taka in survey 1 to 4095 Taka in survey 6 and then fell to 3665 Taka in survey 7. By male and female headed HH By NGOs Urban DSK UTTARAN after Survey 5
Assets Animal ownership: There was a highly significant increase in animal ownership between surveys 1 and 4 (up from 28.4% to 63.9%) followed by a very slight fall in survey 7 (63.4%). Significant increases in 1&4
There were highly significant increases in the amount spent on purchasing animals between the three surveys in both MHHs and FHHs. Overall there was an eightfold increase in spending on animals. The value of animals increased significantly between surveys 1, 4 and 7. Mean value of animals by head of household Mean value of animals by NGO
Ownership of working equipment: increased from 56.1% in survey 1 to 74.6% in survey 4 and 84.5% in survey 7. Increases occurred in both MHHs and FHHs and in all three surveys MHHs owned more working equipment (over 90% of MHHs owned working equipment in survey 7 compared with 76% of FHHs). The value of working equipment only increased significantly between surveys 1 and 4. Mean value of equipment by head of household Mean value of equipment by NGO
Ownership of household belongings:increased significantly (there were large increases in ownership of a mobile phone, wooden box, mattress and chair), more so in MHHs Overall the number of household goods owned increased from 3.2 (maximum 13) in survey 1 to 4.6 in survey 7. Mean number of household goods owned by head of household Mean number of household goods owned by NGO
The value of household equipment increased significantly between surveys 1, 4 and 7. Mean value of household goods by head of household Mean value of household goods by NGO
Total assets: Overall the value of assets rose by, on average, 7000 Taka between surveys 1 and 4, and by 3000 Taka between surveys 4 and 7 (Taka 2,311, 9,322 and 12,413 in survey 1, 4 and 7 respectively) MHHs had significantly higher value of assets in surveys 1 and 7 and the gap was widening. *the question conducted only in surveys 4 and 7
Mean value of total assets by head of household Mean value of total assets by NGO
Income The mean income for male and female headed households by survey was calculated based on HIES criteria which do not include in-kind income. Overall mean income increased consistently from 1,776 Taka/month in survey 1 to 3,298 Taka/month in survey 7 - there was not consistent improvement within urban and rural areas. (These increased income does not take into account the inflation between March 2010 and March 2012) Mean income in household per month by MHHs and FHHs Mean income in household per month by NGO
MHHs per capita income (27.4 Taka pppd) was significantly higher than FHHs (21.4 Taka pppd) and the difference was apparent in all seven surveys. Over the seven surveys the mean per capita income in the urban area was significantly higher than the rural areas. Rural MHHs earned on average 5.4 Taka pppd more than FHHs (23.9 versus 18.5 Taka pppd, respectively). Households from CARE and UTTARAN had the highest mean income pppd (24.2 and 26.9, respectively) and SCF the lowest (17.4 Taka pppd). Mean income pppd by MHHs and FHHs Mean income pppd by NGO
Mean income per household *Red shows significant difference between MHHs and FHHs Mean income per capita
In-kind income FHHs had significantly greater in-kind income than MHHs for the first three surveys but thereafter MHHs had greater in-kind income. NETZ had the highest in-kind income in surveys 6 and 7.
The percentage that in-kind income contributed to total income in the total sample and it ranged between 18% and 23% in the total sample. In FHHs the percentage tended to fall from survey 1 to survey 7 and to rise in MHHs. There was no consistent pattern by NGOs.
Expenditure *Red shows significant difference between MHHs and FHHs Monthly mean expenditure (HIES, Taka per month) Monthly mean expenditure per capita (HIES, Taka per month)
Total per capita expenditure increased significantly over the seven surveys from a low in survey 2 of 19.5 Taka pppd to the highest in survey 7 of 26.3 Taka pppd. There were no significant differences between MHHs and FHHs. Overall the urban areas had greatest expenditure. The rural analyses indicated no significant differences in overall means, by head of household or between NGOs over the seven surveys. Mean total expenditure pppd by NGO Mean total expenditure pppd by head of household
Food expenditure Mean food expenditure pppd by MHHs and FHHs Mean food expenditure pppd by NGO MHHs spent more on food, on average, than FHHs (17.5 vs 15.5 Taka pppd), although the difference appeared to be decreasing UTTARAN moved from having the lowest mean of any rural NGO in survey 1 to having the highest mean food expenditure of the rural NGOs in survey 7
Household expenditure Mean household expenditure pppd by NGO Mean household expenditure pppd by MHHs and FHHs There was no significant difference between MHHs and FHHs Significantly higher spending in the urban area was found, but there were no significant differences between the overall rural means by NGOs
Work-related expenditure Mean work-related expenditure pppd by NGO Mean work-related expenditure pppd by MHHs and FHHs The amount spent on work-related items increased significantly across the surveys from 20 Taka to 106 Taka between surveys 1 and 7 Considerably more spent in the urban areas, on average, than in the rural areas (mean 193 versus 48 Taka, respectively) although the gap appears to be lessening
Difference between income and expenditure (net income) Households went from a debit in surveys 1 to 3 (-437, -33, -52 Taka/month respectively) to increasing credit in surveys 4 to 7 (+565, +891, +989 and +1076 Taka/month, respectively). MHHs were significantly more in credit than FHHs over the 7 surveys by, on average, 400 Taka/month. When the average of the seven surveys was calculated all NGOs were in credit ranging from 3 Taka/month to 778 Taka/month. Mean monthly net income by MHHs and FHHs Mean monthly net income by NGOs
Household food intake and security Rice was eaten by nearly all households in all seven surveys. Comparison of March 2011 and March 2013 revealed an increase in fresh fish consumption, pulses, green and other vegetables.
Overall food diversity rose from 4.3 in survey 1 to 5.3 in surveys 5 and 6 before falling slightly to 5.2 in survey 7. There was no significant difference between MHHs and FHHs. Mean number of food types consumed by MHHs and FHHs Mean number of food types consumed by NGO NB: The extent of household food diversity was determined in two ways (a) based on the mean of the number of foods eaten (maximum 13) and (b) based on the 7 food groups (grains, roots and tubers, legumes and nuts, dairy products, flesh foods, eggs, vitamin A rich fruits and vegetables and other fruit and vegetables) as defined by WHO and UNICEF.
The households were asked about the coping strategies they used as a result of financial hardship in the seven days prior to the survey. There were significant improvements in all 10 strategies between surveys 1 and 7. Mean food coping strategy by NGO Mean food coping strategy by MHHs and FHHs
Social empowerment Overall the responses were quite consistent. More women in survey 7 felt there were people who could be relied upon to help and less women in surveys 4 and 7 felt frightened of moving alone outside their village.