1 / 49

Fig. 10.44bc

Fig. 10.44bc. Fig. 10.44a. Fig. 10.38. Fig. 10.45. Fig. 10.9. Fig. 10.39. Fig. 10.17a-b. Fig. 10.17c. Fig. 10.29a. Fig. 10.29b. Fig. 10.26. Fig. 10.28ab. Fig. 10.27. Fig. 10.24. Fig. 10.28c. Fig. 10.5. Watershed/Drainage basin.

Télécharger la présentation

Fig. 10.44bc

An Image/Link below is provided (as is) to download presentation Download Policy: Content on the Website is provided to you AS IS for your information and personal use and may not be sold / licensed / shared on other websites without getting consent from its author. Content is provided to you AS IS for your information and personal use only. Download presentation by click this link. While downloading, if for some reason you are not able to download a presentation, the publisher may have deleted the file from their server. During download, if you can't get a presentation, the file might be deleted by the publisher.

E N D

Presentation Transcript


  1. Fig. 10.44bc

  2. Fig. 10.44a

  3. Fig. 10.38

  4. Fig. 10.45

  5. Fig. 10.9

  6. Fig. 10.39

  7. Fig. 10.17a-b

  8. Fig. 10.17c

  9. Fig. 10.29a

  10. Fig. 10.29b

  11. Fig. 10.26

  12. Fig. 10.28ab

  13. Fig. 10.27

  14. Fig. 10.24

  15. Fig. 10.28c

  16. Fig. 10.5

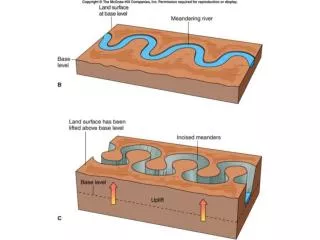
  17. Watershed/Drainage basin The area drained by a stream system. Can be very small or very large.

  18. Fig. 10.4

  19. Fig. 10.10

  20. Fig. 10.12

  21. Fig. 10.14

  22. Fig. 10.19a

  23. Fig. 10.19b

  24. Fig. 10.3a

  25. Fig. 10.3b

  26. Fig. 10.30

  27. Fig. 10.33b

  28. Fig. 10.36

  29. Fig. 10.23

  30. Stream Terraces

  31. Fig. 10.43

  32. Fig. 10.42

  33. Table Box10.2

  34. “100” Year Flood • R = (n+1)/m R = recurrence interval n = years of record m = rank

  35. Table Box10.2

  36. Examples R = (90+1)/2 = 45.5 About 2% chance each year R = (90+l)/1 = 91 About 1% chance per year

  37. Table Box10.2

  38. Box10.2.3

  39. Waterfalls • Caused by underlying incompetent rock that is eroded away.

  40. Fig. 10.37d

  41. 0090

  42. 0094

  43. 0089

More Related