
Fig S1
pS2. CCNG2. *. *. *. *. *. *. *. *. *. MCF7. *. *. KLF6. CLDN4. CERK. *. *. RPRM. *. *. *. *. *. *. *. *. *. *. *. *. *. *. *. EFEMP1. ENC1. BIK. HBP1. *. CXCR4. RAP1GA1. BMP7. *. *. *. *. *. *. *. *. CDH3. *. *. *. *. *. *. *. *. *. *.
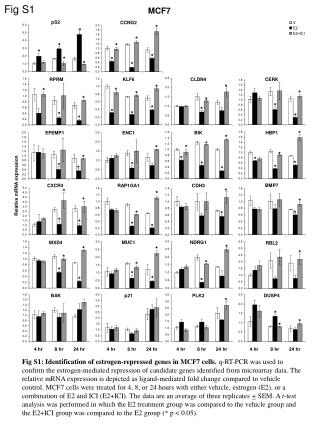

Fig S1
E N D
Presentation Transcript
pS2 CCNG2 * * * * * * * * * MCF7 * * KLF6 CLDN4 CERK * * RPRM * * * * * * * * * * * * * * * EFEMP1 ENC1 BIK HBP1 * CXCR4 RAP1GA1 BMP7 * * * * * * * * CDH3 * * * * * * * * * * * * * * * * * * Relative mRNA expression MXD4 MUC1 NDRG1 RBL2 * * * * * * * * * * * * p21 PLK2 DUSP4 * * BAK * * 4 hr 8 hr 24 hr 4 hr 8 hr 24 hr 4 hr 8 hr 24 hr 4 hr 8 hr 24 hr Fig S1 Fig S1: Identification of estrogen-repressed genes in MCF7 cells. q-RT-PCR was used to confirm the estrogen-mediated repression of candidate genes identified from microarray data. The relative mRNA expression is depicted as ligand-mediated fold change compared to vehicle control. MCF7 cells were treated for 4, 8, or 24 hours with either vehicle, estrogen (E2), or a combination of E2 and ICI (E2+ICI). The data are an average of three replicates + SEM. A t-test analysis was performed in which the E2 treatment group was compared to the vehicle group and the E2+ICI group was compared to the E2 group (* p < 0.05).
Fig S2 RPRM KLF6 CLDN4 * * * * * * * * 4 hr 4 hr 4 hr 4 hr 4 hr 4 hr 8 hr 8 hr 8 hr 8 hr 8 hr 8 hr 24 hr 24 hr 24 hr 24 hr 24 hr 24 hr ZR-75-1 A CERK EFEMP1 ENC1 Relative mRNA expression * B T47D RPRM KLF6 CLDN4 * * Relative mRNA expression CERK EFEMP1 ENC1 * * * * * * * Fig S2: Estrogen-mediated repression of selected genes in breast cancer cells. q-RT-PCR was used to confirm the estrogen-mediated repression of candidate genes identified from microarray data. The relative mRNA expression is depicted as ligand-mediated fold change compared to vehicle control. (A) ZR-75-1 and (B) T47D cells were treated for 4, 8, or 24 hours with either vehicle, estrogen (E2), or a combination of E2 and ICI. The data are an average of three replicates + SEM. A t-test analysis was performed in which the E2 treatment group was compared to the vehicle group and the E2+ICI group was compared to the E2 group (* p < 0.05).
Fig S3 A 4h 8h + + + + E2 - + - + CHX KLF6 CLDN4 CERK EFEMP1 ENC1 BIK HBP1 CXCR4 RAP1GA1 CDH3 BMP7 MXD4 NDRG1 RBL2 FLOT1 RND3 TENS1 IER3 <0.3 0.5-0.7 0.9-1.1 1.3-1.5 >2 0.3-0.5 0.7-0.9 1.1-1.3 1.5-1.9 E2 Fold change Fig S3: Identification of E2-repressed genes that are primary ERα targets. (A) MCF7 cells were treated with either vehicle, estrogen (E2), or a combination of E2 and cycloheximide (CHX). q-RT-PCR was used to calculate relative mRNA expression as ligand-mediated fold change compared to vehicle control. This fold change is reflected in the color intensity as shown in the legend.
Fig S4 A HDAC1 HDAC2 HDAC3 HDAC4 HDAC5 siNS siHDAC1 siNS siHDAC2 siNS siHDAC3 siNS siHDAC4 siNS siHDAC5 Relative mRNA expression HDAC6 HDAC7 HDAC8 HDAC9 HDAC10 siNS siHDAC6 siNS siHDAC7 siNS siHDAC8 siNS siHDAC9 siNS siHDAC10 B RPRM siNS siHDAC1 siNS siHDAC2 siNS siHDAC3 siNS siHDAC4 siNS siHDAC5 Relative mRNA expression siNS siHDAC6 siNS siHDAC7 siNS siHDAC8 siNS siHDAC9 siNS siHDAC10 Fig S4: Knockdown of HDAC1-10 and its effect on RPRM expression. MCF7 cells were transfected with non-specific siRNA (siNS) or siRNA against HDAC1-10 (siHDAC1-10) followed by either a vehicle or an E2 treatment for 12 hrs. The knockdown of each HDAC is shown in (A) and its effect on RPRM expression is shown in (B). q-RT-PCR was used to calculate relative mRNA expression as fold change compared to vehicle control. The data are an average of three replicates + SEM.
Fig S5 B A HDAC7 HDAC7(1-487) HDAC7 (438-912) HDAC7 (H670A) MW (kDa) 150 100 Flag 75 50 45 β-actin - + - - - HDAC7: - - + - - HDAC7 (1-487): - - - - + HDAC7 (438-912): - - - + - HDAC7 (H670A): Fig S5: Localization and expression of the HDAC7 deletion and mutant constructs. (A) 293 cells were transfected with Flag-HDAC, Flag-HDAC7 (1-487), Flag-HDAC7 (438-912), and Flag-HDAC7 (H670A) and immunostained for Flag. (B) 293 cells were transfected with Flag-HDAC, Flag-HDAC7 (1-487), Flag-HDAC7 (438-912), and Flag-HDAC7 (H670A) and blot for Flag and β-actin.
* * A SYBR Green assay was used for genes lacking a probe.


![[Fig. S1]](https://cdn3.slideserve.com/6448662/slide1-dt.jpg)


