Summer 2003
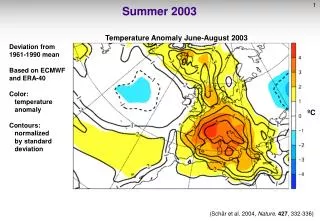
Summer 2003. Temperature Anomaly June-August 2003. Deviation from 1961-1990 mean Based on ECMWF and ERA-40 Color: temperature anomaly Contours: normalized by standard deviation. ºC. (Schär et al. 2004, Nature , 427 , 332-336). Geopotential Height, 500 hPa. Summer 2003.

Summer 2003
E N D
Presentation Transcript
Summer 2003 Temperature Anomaly June-August 2003 Deviation from 1961-1990 mean Based on ECMWF and ERA-40 Color: temperature anomaly Contours: normalized by standard deviation ºC (Schär et al. 2004, Nature, 427, 332-336)
Geopotential Height, 500 hPa Summer 2003 Deviation from 1961-1990 mean Based on ECMWF and ERA-40 Color: height anomaly Bold contours: anomalies normalized by standard deviation m Mark Liniger
Precipitation Anomaly Summer 2003 Deviation from 1961-1990 mean Data: GPCC %
Estimation of Return Periods 10 y 10 y extremely rare event 100 y 100 y mean 1000 y 1000 y Swiss Temperature Series 1864-2003 (mean of 4 stations) (Schär et al. 2004, Nature, 427, 332-336)
Changes in Mean Frequency Temperature cold cold warm warm increase in the frequency of extreme warm conditions increase in the frequency of extreme warm/cold conditions For extremes far away from mean, “variability is more important than mean” versus Changes in Variability (Katz and Brown 1992, Folland et al. 2001, IPCC, 2001)
Summer Variability in Climate Change Scenarios Greenhouse-Gas Scenario (IPCC SRES A2) Coupled GCM (HadCM3, ~300 km) Atmospheric GCM (HadAM3, ~120 km) Regional Climate Model (RCM) (CHRM / ETH, 56 km) Time slice experiments CTRL (1961-1990) SCEN (2071-2100) (EU-Project PRUDENCE, NCCR Climate)
Simulated Summer Temperatures Simulated: T= 16.1 ºCs= 0.97 ºC Observed: T = 16.9 ºCs= 0.94 ºC SCEN2071-2100 strong increase in variability DT=4.6 ºC Ds/s=100% Gridpoint near Zurich CTRL1961-1990 (Schär et al. 2004, Nature, 427, 332-336)
Change in Mean Temperature DT Change in Variability Ds/s [ºC] [%] Summer (JJA) (Schär et al. 2004, Nature, 427, 332-336)
Comparison of T and P anomalies (with respect to 1961-1990) OBS: Swiss Series 1864-2003 SIM: CTRLand SCEN. OBS: 2003 Simulations suggest that by the end of the century every second summer is as warm or warmer (and as dry or dryer) than JJA2003 (Schär et al. 2004, Nature, 427, 332-336)