Download
1 / 1
10 likes | 84 Vues
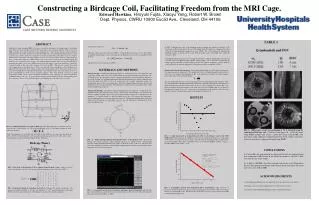
Constructing a Birdcage Coil, Facilitating Freedom from the MRI Cage. ABSTRACT.

E N D
Constructing a Birdcage Coil, Facilitating Freedom from the MRI Cage. ABSTRACT Magnetic Resonance Imaging (MRI) is the union of medicine and physics, producing images of the human body which are physiologically relevant while employing only non-invasive magnetic fields as detectors. MRI is a highly developed if relatively young discipline, but to better fit the special conditions ideal for imaging people, the need is great for more specialized RF coils. One particularly pertinent idea is to insert a microcoil in a catheter and use it to image blood vessels and other tubes within the body in vivo. Before clinical trials of prototypes can begin, images of blood vessels from cadavers must be validated using a more conventional external coil. While many receive coils could be used for the redundant imaging, the birdcage coil is an elegant choice because of its uniquely uniform internal field; it is especially efficient at increasing the signal to noise ratio (SNR) because its field is tuned to rotate at the frequency of hydrogen atoms precessing in the large static magnetic field used in MRI. This project is partly theoretical: electromagnetic theory has been used to derive the sinusoidal current distributions of the birdcage coil. Maxwell’s laws dictate that these currents produce the desired magnetic field. Prototype coils for several static field strengths have confirmed the advantages of the birdcage design. The coils, fabricated de novo, present significantly less need for post-acquisition analysis. The 7.0 T birdcage coil has good field homogeneity within a FOV = 6 cm and has an unloaded Q = 163. Imaging of a kiwi and a phantom confirm the utility of the coil. To go with the knowledge gained from this project, the small imaging center has a new line of receive coils specially engineered for imaging mice and cadaver blood vessels. Birdcage Theory MATERIALS AND METHODS • Birdcage Design: G10 fiberglass tubing was used as a cylindrical base for coil construction, and copper tape (width = 0.6 cm) is used as the medium for the actual circuitry of the birdcage coil. Following Tropp, the capacitance needed to generate quadrature at a given frequency and with a given coil geometry was calculated numerically. Because the inductances possible are limited by the desired geometry and FOV of the coil, and because the possible capacitance values are pragmatically discrete, the coil generally has a different resonant frequency than that desired, and must be tuned to the desired frequency. The birdcage coil is driven by two sinusoidal voltages offset by 90º along the edge of the coil. • Tuning and Matching:We achieve tuning and matching via two capacitors for each of the two quadrature modes. We match the large, mostly complex load of the birdcage to the 50 Ω coaxial cables by adding a variable capacitor in series with each cable’s connection, so that reflections are minimized. A variable capacitor is added in parallel across the coil to increase the capacitance, thereby reducing the lowest resonant frequency of the coil. Tuning and matching can be performed using a network analyzer as the voltage source for the coil, allowing for determination of the effective impedance and resonant frequency simultaneously. • Quality and Linearity Measurement: After tuning and matching, the coil’s quality and linearity of transmission can be characterized. The quality factor (Q) is determined using the equation below, where Δω is the width at half minimum (-3 dB) of the reflectance around the resonant frequency, and ω is the value of the resonant frequency. • The drop in the reflected power occurs at the Larmour (static field) frequency; the sharpness of the drop (the bandwidth of the RF field) partially characterizes the SNR.3 The linearity of transmission in the axial direction was measured by means of a loop of wire connected via coaxial cable to the Network Analyzer, with measurements of the reflected power at 63.80 MHz taken at 1 cm intervals throughout the length of the coil. Linear fits were performed on the portions of the data that appeared visually to fall in the linear range of the magnetic field drop-off. Edward Hawkins, Hiroyuki Fujita, Xiaoyu Yang, Robert W. Brown Dept. Physics, CWRU 10900 Euclid Ave., Cleveland, OH 44106 Solutions are of the form: In FIG. 5, changing the value of the matching capacitor changes the reflection coefficient of the transition from the coaxial cable to the coil. In the Smith Chart, this appears as a change in the radius of the circle representing the standing wave ratio (SWR). The coil is matched by adjusting the matching capacitor so that the circle crosses 50 Ω along the x-axis of the Smith chart, where the reactance is 0 Ω. Adjusting the tuning capacitor does not change the reflection coefficient significantly, since the load is several orders of magnitude larger than the relative change. The coil is tuned by adjusting the tuning capacitor until the resonant frequency desired, the Larmour frequency, coincides with the point on the circle at which the impedance is all resistance and has a magnitude of 50 Ω. where φ is orthogonal to the z direction in FIG. 1. Using the Biot-Savart Law, one can show that for an infinitely long birdcage coil, the sinusoidal current distribution formed creates a magnetic field of the form with the directions of x and y given in FIG. 1. RESULTS y z Bo x FIG. 1: Schematic Diagram of a Low-Pass Birdcage Coil. The capacitors are oriented as shown, along the legs of the birdcage coil. The legs and end-rings of the coil are taken as inductors, with inductance given by where the inductance (L) is in µH, and the length (l) and width (w) of copper tape are given in meters. The theoretical inductance is only an approximation in practice because of the many corners of the physical coil, which drastically change the true inductance. FIG. 8: MRI images a kiwi and a phantom at 7.0 T, obtained using the experimental birdcage coil. Clockwise from upper left: axial kiwi image using RARE (multiple spin echoes), sagittal kiwi image using RARE, axial kiwi image using a diffusion-weighted protocol to show a bruise in the kiwi, and an axial image of a phantom obtained using RARE. FIG. 6: Axial homogeneity as transmitted power (dB) vs. axial distance (cm) for the 63.80 MHz Coil. The horizontal line at -10 dB is the cutoff for homogeneous B1 behavior, corresponding to 90% of the power input into the coil using a network analyzer returning through a pickup used to measure the magnetic field. This sets the FOV of the coil. For the 63.80 MHz coil, FOV ~ 6 cm, for the 300.5 MHz resonator, FOV ~ 5 cm. FIG. 4: Tuning and Matching Each Quadrature Mode of the Birdcage Coil. Because the birdcage has a large reactance (~2kΩ), matching capacitors are added in series. Using tuning capacitors added in parallel minimizes their impact on the homogeneity of the coil. This setup also necessitates building coils with resonant frequencies higher than the desired resonant frequency, since tuning can only decrease the frequency. CONCLUSIONS 1) Custom RF coils manufactured at a fraction of the cost of commercial coils have comparable SNR because of the ability to construct a coil with a FOV very near the size of the sample. 2) At high (≥ 300 MHz), the effects of higher order terms in the Tropp theory become more pronounced. Further study of these effects constitutes one of the most active new fields in MRI. FIG. 2: One Node of the Birdcage Coil for Analysis Using Kirchoff’s Laws. Analysis of the N loops of the birdcage coil leads to N equations and an impedance matrix of the form of FIG. 3. ACKNOWLEDGMENTS Jeremy Heilman and Mark Griswold – help with electronics and the network analyzer Tim Eagan – help with understanding the theory of the birdcage resonator Chris Flask and the Small Animal Imaging Center – funding and lab space FIG. 7: Logarithmic variation of B1 transmitted (dB) vs. Axial Distance (cm). Linear fits of the data show that the field drops off from near total transmission at the center of the coil in a linear fashion on a decibel (dB) scale. This knowledge can be used in postprocessing to increase the SNR of images taken using the coils. FIG. 3: Impedance Matrix for a Birdcage Coil with N = 8 Legs. This matrix corresponds to the general case displayed in FIG. 2. For the coils fabricated, C1 = 0. Using the impedance matrix and Ohm’s law, the resonant frequencies of the birdcage coil can be theoretically calculated. FIG. 5: Screenshot from the Network Analyzer depicting a tuned and matched coil. The blue trace is the Smith Chart, and the yellow trace is the variation of reflected power (dB) with frequency. The range depicted is 62 MHz – 64 MHz.