Develop data collection protocols
Identify research topic and gain relevant scientific knowledge. Isolate variables and design experiments. Communicate in a scientific style. Locate and understand related research. Field Implementation. Develop data collection protocols. Data Analysis and Interpretation.

Develop data collection protocols
E N D
Presentation Transcript
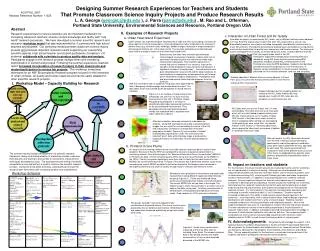
Identify research topic and gain relevant scientific knowledge Isolate variables and design experiments Communicate in a scientific style Locate and understand related research Field Implementation Develop data collection protocols Data Analysis and Interpretation MWDO Figure b.1 Designing Summer Research Experiences for Teachers and Students That Promote Classroom Science Inquiry Projects and Produce Research Results L. A. George (georgeL@pdx.edu ), J. Parra (parra@pdx.edu) , M. Rao and L. Offerman, Portland State University, Environmental Sciences and Resource, Portland Oregon USA AGU FALL 2007 Abstract Reference Number: 11325 Abstract Research experiences for science teachers are an important mechanism for increasing classroom teachers' science content knowledge and facility with "real world" research processes. We have developed a summer scientific research and education workshop model that was implemented for 3 summers with high school teachers and students. Our workshop model promotes classroom science inquiry projects and produces important research results supporting our overarching scientific agenda. High school teacher and student participants (5 teachers +10 students) collaborate with scientists to produce quality data and analysis. Participants engage in the research process multiple times with increasing sophistication in content and process. Following the summer experience, teachers report increased incorporation of research inquiry in their classrooms and student participation in science fair projects. This workshop format was developed for an NSF Biocomplexity Research program focused on the interaction of urban climates, air quality and human response and can be easily adapted for other scientific research projects. II. Examples of Research Projects c. Interaction of Urban Forest and Air Quality a. Urban Heat Island Experiment How does air quality, as measured by NO2 levels, vary in different land-use zones adjacent to Forest Park (the largest urban forest in the US)? NO2 levels within a city can vary dramatically based on many factors including topography, wind direction and proximity to major NO2 emitters. Participants learned about landuse types and landcover configurations and how they might effect air quality from researchers and literature review. The study goal was to investigate how air quality, as measured by NO2 levels, varied in different land-use zones adjacent to Forest Park (the largest urban forest in the US). Urban centers can experience higher temperatures at night than their surrounding rural and sub-urban regions not wholly explained by natural geography but rather attributed to the increase in thermal mass (e.g. concrete roads, buildings), albedo changes, decrease in evapotranspiration, anthropogenic heating. etc. of the urban center. The resultant temperature contrast between urban and rural areas is known as the Urban Heat Island (UHI). Because very few cities have extensive ground based meteorological measurement networks, studies which aim at accurately characterizing the heat island must make large measurement campaigns. This is perfect opportunity to involve high school students in our research, they can be trained to make temperature measurements and represent a significant increase in “people power”. Several lectures were given describing the nature of UHI and the ideal conditions for representative air temperature measurements as put forward by the World Meteorological Organization. Participants read and discussed several urban heat island papers from the literature. Participants acquired knowledge about searching electronic databases, using GIS, basic statistics and accessing EPA databases. Students located NO2 emitting facilities in the Portland area using the EPA databases. Students also identified prevalent seasonal wind directions in the Portland area. A literature survey indicated that not much research had been published on the correlation between land-use and air quality. Students identified 7 different land-use zones adjacent to Forest Park, plus one control site that was entirely within Forest Park for setting up NO2 measurement. Figure a.1 I. Workshop Model – Capacity Building for Research With this information and our guidance, the groups were appointed the task of designing a field campaign and measurement protocol. The data sheet shown was created by the participants to record relevant variables. Students decided upon an sampling pattern for setting up the NO2 tubes. Additionally, they agreed upon roughly 30 NO2 tubes per site, including 2-4 control blanks per site. Figure a.1 is an example of measurement sites selected by one cohort for an early morning measurement of the UHI in Portland, Oregon. We guide the participants in arriving in a scientifically defensible measurement protocol for the ground-based measurement. They developed naturally aspirated temperature shields that compared well to aspirated ones under nighttime conditions. NO2 tubes were set up over 3 days, with 2-3 sites covered daily. Two tubes were set up at every grid point, with a control added at approximately every fifth site. Tubes were set out for roughly 2 weeks. GPS location of the tubes was noted, as well as time of uncapping (when setting out) and capping (when picking up) were noted. Also, any special features of the location or interesting observation when capping the tubes (such a presence of spiders or raindrops) were also noted. After data collection, data was entered into a database for analysis. Using GIS, participants were able to produce spatial images that are useful for communicating the nature of the UHI and making clear correlations of temperature and other geographic variables. Figure a.2) is an example of student collected data imported into a GIS. The inset shows the collected “point” data, while the large image is produced by treating the data in an elementary “inverse squared distance” model. After two weeks, the NO2 tubes were retrieved from the field. Chemical assays followed by spectrometry and plotting against a calibration curve were used to determine the NO2 absorbed by each tube. NO2 levels were plotted and analyzed for each of the different land-use zones. Other teams investigated lichen diversity, plant diversity, temperature and particulate matter in these areas. Figure a.2 b. Portland Ozone Plume An urban ozone monitoring network serves to provide important exposure data to scientist and residents. Because of this the EPA has mandated that several site types be represented in a monitoring network. One of these types is the “Maximum Downwind Ozone Concentration” (MDWO). In Portland, the Dept. of Environmental Quality (DEQ) set up the Carus Road site as the MDWO in the 1970s. The city has grown significantly since then and it is likely that the ideal location for the MDWO has moved further downwind. The goal of this project was to determine whether ozone levels exceeding the current MDWO could be found further downwind. Participants were introduced to atmospheric chemistry and urban air quality through lecture, exercises and literature review. The summer training includes development of a scientific research framework, design and implementation of preliminary studies, extensive field research and training in and access to instruments, measurement techniques and statistical tools. The development and writing of scientific presentations (oral and written) is used to reinforce the scientific research process. During the three-week workshop, participants go through the research path three times with increasing duration and sophistication. III. Impact on teachers and students For the most part, the actual research projects we conduct during the summer workshops are not reproducible in a classroom setting. (Although we have developed some measurement protocols that teachers have been able to use for classroom projects, such us lichen biomonitoring, NO2 monitoring with Palmes-type tubes and urban temperature variation measurements.) In addition to enjoying being part of an authentic research endeavor, the most significant impact that teachers and students report is increased confidence in developing and conducting a research project. By modeling how to develop and implement two research inquiries during the first week and conducting an in depth study during the 2nd and 3rd weeks, both teachers and students start to internalize the research process. For many teachers, this was their first experience developing and conducting a scientific research project (12 out 15 teachers). Teachers reported increased confidence in their ability to lead research project-based inquiries in the classroom -- most importantly, how to setup research ideas, lead the design of protocol development with students and how to write a research paper. Students reported increased confidence in thinking scientifically and conducting research. Most of the student participants have gone on to participate in science fairs (winning several awards). The main educational outcome of the workshop experience is the development of research inquiry skills. In addition, participants reported increased content knowledge in the areas of urban climate modification and urban air pollution. The research projects conducted over three summers have provided researchers with important model validation data for FUSE, as well as useful preliminary data for future projects. Workshop Schedule Participants were grouped into three teams and each made measurements along different trajectories determined by the group (figure b.1). Ozone was measured using continuous sampling devices (Dasibi ozone photometers). The current MDWO site can be seen in the image. The objective was to make measurements in a timely manner to capture the daily ozone peak. Ancillary measurements of wind direction, wind speed and temperature were also made. Grab samples for VOCs were also collected. The groups traveled in cars and stopped to take measurements at spaced interval. The ozone monitors were powered by the car batteries and inverters. Wind direction and speed were measured qualitatively using home made wind vanes. Figure b.2 IV. Acknowledgements : We gratefully acknowledge the support of the National Science Foundation-Biocomplexity in the Environment Project Award #0410103. We are grateful for the participation and collaboration of our research partners David Sailor, Jan Semenza, Melissa Hart, Sara Eppley, Vivek Shandas, Dean Atkinson and Andrew Rice. We are especially grateful for the hard work, commitment and good cheer of the students and teacher participants (15 teachers and 36 students). Figure b.2 shows ozone concentration measured at the three DEQ stations including Carus Road. The student collected data is also plotted showing that higher concentrations of ozone were observed downwind of the MDWO site.