Download
1 / 39
390 likes | 513 Vues
Attribution of Recent Increases in Atlantic Hurricane Activity. Kevin E Trenberth NCAR. Issues for detection and attribution of changes in hurricanes. What has happened? How good is the observational record? How should hurricanes change as climate changes? Are models adequate?

E N D
Attribution of Recent Increases in Atlantic Hurricane Activity Kevin E Trenberth NCAR
Issues for detection and attribution of changes in hurricanes • What has happened? • How good is the observational record? • How should hurricanes change as climate changes? • Are models adequate? • What is the role of global warming? • What is the role of natural variability? • What do models reveal?
Ivan 15 Sept 2004 1850 UTC
Katrina’s aftermath Refugees in USA Aug 31
Maria Nate Ophelia
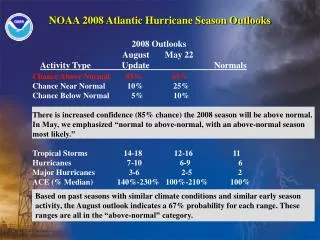
North Atlantic Hurricanes 2005 • A record breaking year: • Strongest Gulf hurricane month of July (Dennis) • Most named storms (27*: normal 10) • Most hurricanes (15: normal 6 1970-2004) • First ever V, W, , , , , , • Strongest hurricane on record: Wilma (882 mb) • Strongest hurricane in Gulf: Rita (897 mb) • Most cat. 5 storms in season (4 vs 2 in 1960,1961) • Deadliest hurricane in US since 1928 (Katrina) • Costliest natural disaster in US history (Katrina) • Highest insured losses $40-60B vs Andrew $21B • Total losses $125-200B • 6 of the 8 most damaging occurred Aug 04-Oct05 Charlie, Ivan, Francis, Katrina, Rita, Wilma • Hurricane Vince (October) first to hit Portugal/Spain
1995 Atlantic Tropical Cyclone Trends Satellites Start of aircraft surveillance Greg Holland
1995 1995 1995 Atlantic Hurricane Trends Named Cat 1+2 Storms Hurricanes Cat 3-5 Greg Holland
Issues on changing damage from hurricanes Landfalling hurricanes are a very small fraction of all hurricanes and the sample is small. Where they make landfall is chance, and 10 miles (e.g., Andrew) can make a huge difference to damage. The increased vulnerability of people with increased property value building in coastal zones, placing themselves in harms way, makes changes in hurricane intensity even more important. 100 years of tropical storm tracks in Atlantic
Hurricanes: • Depend on SSTs > 26ºC (80ºF) • High water vapor content • Weak wind shear (or vortex comes apart) • Weak static stability • Pre-existing disturbance • Large variability year to year in individual basins. • El Niño means more action in Pacific, suppression in Atlantic • Large decadal variability in Atlantic
Better measure of tropical cyclone activity: Simplified “Power Dissipation Index” (Emanuel 2005): Courtesy: K. Emanuel
Atlantic + western North Pacific Courtesy: K. Emanuel Revised
A large increase is seen in the number and proportion of hurricanes reaching categories 4 and 5. The largest increase occurs in the North Pacific, the Indian and Southwest Pacific oceans, and smallest increase in the North Atlantic Ocean. From Webster et al (2005)
But what about global SST warming? More definitive AMO index 0.45C 0.04C The Atlantic Multi-decadal Oscillation AMO index defined by Enfield et al. (2001) as mean SST north of equator in Atlantic: then take 10 year running mean. Base period 1901-70.
Dec 2004 Nino3.4 0.9C Regression with Nino3.4 8 months later: 0.2C in Tropical Atlantic Atlantic SSTs 10-20N0.92C above 1901-70 normal. All time record. Due to weak trades and reduced LH fluxes. Global warming: 0.45C 2004-05 El Niño: 0.2C AMO: <0.1C Trenberth et al 2002 Trenberth and Shea 2006
Monthly SSTanomalies for (A) Atlantic and (B) Pacific tropical cyclogenesis regions: Observed (black) and 22 climate models. Model data are smoothed: 2 groups: with and without volcanic forcing (V and No-V) and end in 1999. The yellow and grey envelopes are 1 and 2 confidence intervals for the V averages. Santer et al 2006 Is the variability realistic? Do the models simulate observed?
Models show signal to noise of natural variability is large: trend can only arise from increased GHGs: Contribution of different external forcings to SST changes in the Atlantic (A) and Pacific (B) tropical cyclogenesis regions. Results are from a 20CEN run and from single-forcing experiments performed with the Parallel Climate Model (PCM). Each result is the low-pass filtered average of a four-member ensemble. Santer et al. 2006
Linear regression maps of T106 ECHAM5 AGCM simulated Atlantic TC vertical wind shear (200 -850 hPa) for regions given for 1870-2003. Color gives statistical significance (T-test). Biggest effect is from Pacific. Latif et al 2006 GRL (see Aiyyer and Thorncroft 2006 JCl for obs)
What about 2006? • La Nina in 2005-06 winter (vs El Nino 2004-05) • Jan 2005: light winds, sunny • Jan 2006: much stronger than normal winds • SSTs below normal in west Atlantic earlier; warmed midway thru season • Developing El Nino in Pacific • Unfavorable conditions for TCs in Atlantic: wind shear etc. Foltz and McPhaden, GRL 2006 show how the weak NE tradewinds, anomalous latent heat fluxes and solar radiation contributed to the record breaking SSTs in summer 2005
In the tropics, heat from the sun goes into the ocean and is apt to build up: Where does the heat go? • Surface heat cannot radiate to space owing to optically thick water vapor • Heat goes from the ocean into the atmosphere largely through evaporation that is greatly enhanced in tropical storms. It moistens the atmosphere (latent energy) and cools the ocean. 3) Heat and moisture are transported to higher latitudes by extratropical cyclones and anticyclones (cold and warm fronts) mainly in winter. 4) Heat is transported upwards: in convection, especially thunderstorms, tropical storms, hurricanes and other disturbances. Energy and moisture from the surface is moved upwards, typically producing rain, drying the atmosphere, but heating it, and stabilizing the atmosphere against further convection.
Tropical ocean heat balance Hot towers: convective heat transports up Incoming radiation Water vapor greenhouse radiation Latent heat Rain Evaporation Cooling Heating Surface radiation Surface flux Ocean currents
In the tropics, heat from the sun is apt to build up: 4) There is a competition between individual thunderstorms and organized convection to transport heat upwards in the general atmospheric circulation. 5) Tropical storms are much more effective at cooling the ocean.
Cold wake from Katrina and Rita in Gulf of Mexico SST in Gulf NASA
Hypothesis: Hurricanes play a key role in climate, but are not in models and are not parameterized. Prospects are for more intense storms, heavier rainfalls and flooding, and coastal damage, but perhaps lower tropical ocean temperatures?
Hypothesis on effects from global warming • Water vapor over oceans increases ~7% per K SST • To first order, surface latent heat fluxes also increase by at least this amount as E ≈CVqs(Ts)(1-RH) ~ qs(Ts) • Convergence in boundary layer also should go up proportionately. [q, , vr and vr.q squared] • Could also increase intensity: V • Other feedbacks (friction, sea spray, stability etc) • Hence estimated rainfall, latent heating and water vapor in the storms should increased 1.072 = 1.14 or 14%. [7 to 21% error bars] per K. • For observed 0.5K increase in SST this means increases in rainfall and latent heat release in storms by order 7%.
Katrina Katrina 28 Aug 2005 Cat 5
Hurricane Katrina WRF Moving grid 27 Aug 2005 00 Z 4 km WRF, 62 h forecast Mobile Radar
Katrina experiments • Given good track forecasts of Katrina, as well as the diagnostics of the energy and water budgets, we rerun the forecast simulations with SSTs changed by +1C and -1C • The control run has the central pressure 892 mb vs observed 902 mb • +1C: 870 mb: -22 mb • -1C: 910 mb: +18 mb • Max winds 58 m/s (-1) go to 70 m/s (+1) • Order 10% per C
Precipitation is dominated by moisture convergence • Surface flux of moisture is essential: amounts to >1500 Wm-2. • Substantial increases with increasing SSTs: rain increased by 19%/K inside 400 km.
Best track data Model WRF Katrina results of surface fluxes as function of maximum wind at any grid point. 30N-30S Best track data
El Niños For 1990-2005: over 0-400 km radius (5×10¹¹ m2), ocean cooling is 0.52, 0.58, 1.841022 J/yr, or 0.16, 0.185, 0.58 PW.
TC flux climatology The results suggest anevaporative, total enthalpy, precipitation ocean cooling of: 0.16, 0.185, 0.58 PW over a year. Over the tropical ocean 20N to 20S the LH is equivalent to 1.5 W m-2 , or 1.1C/year over a 10 m layer. Globally this is 0.36 and 1.13 W m-2 vs CO2 radiative forcing 1.5 W m-2. It matters! And it is not included in climate models.
Implications for climate models 1) In models, the thunderstorms and convection are not resolved and are dealt with by “sub-grid” scale parameterization. 2) However, most (all?) climate models have premature onset of convection, as seen in the diurnal cycle over land, and feature convection too often and with insufficient intensity. (cf Lin et al. 2006 J Cl) 3) This characteristic likely means that sub-grid scale convection isoverdone at the expense of organized convection (MJO, tropical storms, etc; see Lin et al. 2006, JC). 4) Hence models likely under-predict changes in hurricanes. 5) Hurricanes are missing in models: SSTs may get too warm: increased TCs keep SSTs cooler.
Research questions for detection and attribution of changes in hurricanes • Need to reprocess the satellite record. • Need measures of activity: size, duration, intensity, rainfall, track, ACE, PDI etc • How is TC environment changing and why? • Models must improve in simulation of natural variability: ENSO, AMO, PDO • Need to improve climate models: Resolution; precipitation (frequency, intensity, amount), atmospheric stability, convection (sub-grid scales), tropical transients (storms, MJO, easterly waves) • Coupled problem: must have ocean model • How to parameterize effects of hurricanes?