Download
1 / 22
220 likes | 371 Vues
ACS/WFC CTE correction for point source photometry Marco Chiaberge ACS Team STScI. CHARGE TRANFER EFFICIENCY (CTE) per pixel Defined as CTE = 1 - D Q/Q = 1 - CTI For an ideal CCD CTE = 1.0 For real CCDs CTE < 1 Manufacturing imperfections in the crystalline lattice

E N D
ACS/WFC CTE correction for point source photometry Marco Chiaberge ACS Team STScI
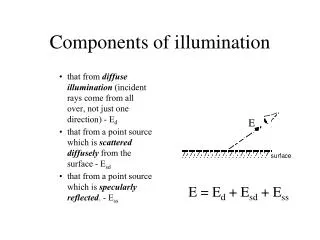
CHARGE TRANFER EFFICIENCY (CTE) per pixel Defined as CTE = 1 - DQ/Q = 1 - CTI For an ideal CCD CTE = 1.0 For real CCDs CTE < 1 Manufacturing imperfections in the crystalline lattice Radiation damage (increasing with time) CTE on ACS was not 1.0 at lunch! The total CTE is CTEN significant effect for large CCDs CTE depends on flux, sky level, # of transfers and time
The effect of CTE on stellar photometry is to reduce the measured flux A significant fraction (all?) of the “lost” flux goes into the “trail”
Timeline of ACS CTE photometric corrections Time dependent formula based on 3 epochs March 2003 – Feb 2004 Riess & Mack ISR 2004-006 Revised formula Chiaberge et al.ISR 2009-01 New approach for data analysis, 4 epochs Increased accuracy mag = 10A• SKYB• FLUXC• Y/2000 • (MJD-52333)/365 New model derived in 2013 to provide more accurate correction Chiaberge ISR 2012-05 Anderson & Bedin 2010 pixel-based CTE correction Included in the new CALACS
WHY DO WE STILL NEED A PHOTOMETRIC CORRECTION FORMULA? We need to keep monitoring the time dependence and make sure that photometry is correctly recovered Some users may prefer to use a correction formula The correction formula may be more accurate for some regions of the parameter space
Post-SM4 Observations Programs: CAL/ACS 11880, 12385, 12730, 13155, 13592 FILTERS: F606W, F502N EXP TIMES: Between 30s and 400s 5 Background levels between ~0.1 and ~40e- Low sky CR-REJECTION, no dithering 1 epoch/cycle Target: 47 Tuc (7’ off center) Cycle 19-20-21: + pointing 3’ south of 47Tuc center for the lowest sky level - 9 external orbits
47 Tuc 7’ off center ~ 2000 stars 47 Tuc 3’ off center ~ 7000 stars
Photometric test Allows to measure the total flux lost and provides correction formulae for photometry. Stars are positioned at different distance from the readout amplifier thus changing the number of transfers and therefore the impact of CTE. D C B A WFC
Photometric test D C Y1 Y2 B A Y Transfers=DY=Y1-Y2 For y=1024 DY=0 Dmag=0 WFC
ANALYSIS PROCEDURE • 1 Generate “clean”, deep, drz image using all data • 2 Identify saturated pixels and mark them • on the DQ extension of FLT files • 3 Mask out area around the saturated stars • 4 Find stars on the deep mosaic, then measure flux of all stars • (ap=3 pix) that are detected on the single_scifiles (aperture phot) • 5 Fit Dmagvs # of transfers for different bins of flux • (rejecting outliers with iterative sigma clipping) • 6 Find the best fit model parameters to reproduce the • dependence of Dmagy=2000 on Sky and Flux levels
F502N 30s Cycle 20 A linear fit is performed for each bin of flux (red lines) Rms errors on the slope are estimated (yellow lines) At y = 2000 Mag loss of 0.69 ± 0.03 mag
CTE Correction formula assumed dependence on flux mag = 10A•SKYB•FLUXC•Y/2000 •(MJD-52333)/365 2 problems: Incompleteness at low fluxes Large deviations from the assumed linear dependence Cycle 17 Cycle 19 Y=2000 0.6 e- 0.3e- 32e-
Well represented by a linear relation in Dmag v Log sky Cycle 19 0.6 e- Dmag = aLog flux + b a,b = a(sky), b(sky) 14e-
Dmag = [aLog(flux) + b] x Y/2000 a = p Log(sky) + q b = p’Log(sky) + q’ Dmag = [p Log(sky) Log(flux) + q Log(flux) + p’ Log(sky) + q’] x Y/2000 p, q, p’, q’ = p(t), q(t), p’(t), q’(t)
Dmag = [p Log(sky) Log(flux) + q Log(flux) + p’ Log(sky) + q’]Y/2000 p, q, p’, q’ = p(t), q(t), p’(t), q’(t) Linear fit using “R”, for each epoch The new time dependence does not assume CTE = 1 at T = Tlaunch
GLOBAL FIT WITH ALL POST-SM4 EPOCHS Δmag (Y, t, SKY, FLUX) = [p1 Log(SKY) Log(FLUX) t + p2 Log(SKY) Log(FLUX) + p’1 Log(SKY) t + +q1Log(Flux) t + p’2 Log(SKY) + q2Log(FLUX) + q’1t + q’2] * Y / 2000 Accuracy
http://www.stsci.edu/hst/acs/performance/cte/ctecorr.py WFC#
Before and after correction test Before Global loss ~16% After Accuracy ~1% F606W 150s sky ~16 e-
Before and after correction test (pixelCTE) Before Global loss at Y=2000 ~16% Pixel-based CTE Global accuracy <6% (overcorrection) F606W 150s sky ~16 e-
Before and after correction test Before Global loss at Y=2000 ~0.65mag After Accuracy <7% F502N 30s sky ~0.6 e-
Comparison with the CALACS pixel-based CTE correction CY20 CTE formula is more accurate than the pix-CTE correction
CONCLUSIONS • Cycle 20 data allowed to derive improved coefficients • Photometric correction is now more accurate than ever • Global accuracy is <3% for most background levels • Largest deviations for very low levels (~7%)