Uncertainty quantification in geophysical inversion: Challenges and the way forward
460 likes | 1.05k Vues
Max A. Meju PETRONAS Exploration, Petronas Twin Towers, Kuala Lumpur. Uncertainty quantification in geophysical inversion: Challenges and the way forward. Workshop on Uncertainty Analysis in Geophysical Inverse Problems, November 7 - 11, 2011. Leiden, The Netherlands. Introduction

Uncertainty quantification in geophysical inversion: Challenges and the way forward
E N D
Presentation Transcript
Max A. Meju PETRONAS Exploration, Petronas Twin Towers, Kuala Lumpur Uncertainty quantification in geophysical inversion: Challenges and the way forward Workshop on Uncertainty Analysis in Geophysical Inverse Problems, November 7 - 11, 2011. Leiden, The Netherlands
Introduction - Sources of uncertainty: nature of geophysical data, modelling error • Methods of uncertainty estimation • Extremal bounds analysis : the nonlinear most-squares approach - Examples from electromagnetic inversion • Challenges & way forward - uncertainty reduction - simple metrics of model uncertainty • Conclusion Outline of lecture
There are various sources of uncertainty - from field surveying to model interpretation Quantifying and reducing the impact of uncertainty in regularized inversion of incomplete, insufficient and inconsistent observational data is a difficult proposition Finding a simple composite measure or index of uncertainty in model interpretation remains a major challenge 1. Introduction
Main causes of uncertainty in geophysical data inversion • Band-limited field measurements (due to technical limitations) • Measurement errors • Geological heterogeneity • Nonlinearity of physical (forward) process. Simulation/prediction errors.
Nature of field data: incomplete, insufficient & inconsistent MT amplitude and phase data for different periods (sec.).
The nature of EM field data and model equivalency lead to uncertainty in interpretation Meju & Sakkas, JGR 2007 3 equivalent 2D resistivity models for the same EM data set from Kenya.
Formally, model uncertainty and non-uniqueness can be reduced by combining measurements of fundamentally different physical attributes of a subsurface target (i.e.,coupled-field analysis) or by using available a priori information about the target, and accounting for 3D geological heterogeneity. • Several approaches to quantifying the uncertainty arising from band-limited data, data errors, and nonlinearity. What can be done to reduce non-uniqueness or quantify uncertainty?
Bayesian probability density function estimation (mostly applied to small-size geophysical inverse problems) • Monte Carlo covariance method for large-scale geophysical inverse problems • Deterministic (mostly applied to small-size inverse problems) : - linear sensitivity analysis (Backus-Gilbert; funnel-function appraisal methods etc), - minimax, - nonlinear extremalbounds analysis (Most-squares method) 2. Methods for Estimating Uncertainty
Problem statement: ‘Given an optimal model for a regularised parameter estimation problem, mopt, find, on account of data errors, solution equivalency and non-uniqueness, other models that satisfy a specified threshold misfit, qms and are consistent with the constraints imposed by the data uncertainties’ 3. Regularised Extremal Bounds Analysis - Nonlinear Most-squares Approach
Problem formulation: Extremize the function mTb, subject to the constraint q = (Wd-Wf(m))T(Wd-Wf(m)) + mTLTLm + (m-mo)T(m-mo) ≤ qms, (1) where b is the model projection operator, and L andare respectively the Laplacian operator and regularisation parameter used for generating mls. The expected value of qms is n-l, where there are l active constraints in the problem. NB: The above problem formulation is appropriate for model construction algorithms that use the additional stabilisation measure, (m-mo)T(m-mo), to place a bound on the absolute size of model perturbation.
An equivalent mathematical statement to Equation (1)is: Extremize: mTb + 1/2µ{(Wd-Wf(m))T(Wd-Wf(m)) + mTLTLm + (m-mo)T(m-mo) - qms} (2)
Next, we need to linearize the expression so that we can solve it using established linear methods! ℓ= mTb + 1/2µ{(Wd-Wf(m))T(Wd-Wf(m)) + mTLTLm + (m-mo)T(m-mo) - qms} NB: If we linearize d=f(m), using Taylor series expansion, we obtain y=Ax. So, ℓ= (m0+ x)Tb + 1/2µ{(Wy-WAx)T(Wy-WAx) + (m0+ x)TLTL(m0+ x) + xTx- qms} (3)
Next, find dℓ/dx and equate to zero for minima/maxima! ℓ = m0Tb +xTb + 1/2µ {yTWTWy - WxTATWy - WyTWAx + xTATWTWAx + (m0TLTLm0) + 2(m0TLTLx)+ (xTLTLx) + xTx- qms} So, dℓ/dx = b + 1/2µ { -2ATEy + 2ATEAx+ 2LTLm0 + 2LTLx + 2Ix} = 0 (4) where E = WTW for notational simplicity!
Next, assemble like-terms and form the Most-Squares Normal Equations! From the previous slide, b + 1/µ [ATEAx + LTLx + Ix] - 1/µ[ATEy - LTLm0] = 0. Therefore, [ATEA + LTL + I]x = [ATEy - LTLm0 -µb], (5) which are the Most-squares Normal Equations (akin to the Least-squares normal equations) and I is the identity matrix.
Finally, solve the Normal Equations for x! From the Normal Equations, we obtain x = [ATEA + LTL + I]-1 [ATEy - LTLm0 -µb]. (6) Nonlinearity is dealt with using an iterative formula of the form mk+1 = mk + x = mk + [ATEA + LTL + I]-1 [ATEy - LTLm0 -µb] (7) where A and y are evaluated at mk and the iteration is begun at k = 0.
Alternatively, obtain the direct estimate of m! Recall that m=mo+x. Replacing x with m-mo in the Normal Equations yields m = [ATEA + LTL + I]-1 {ATEd* + Im0 -µb} (8) where d* = [y + Am0], and = ± {[qms - qls]/(bT [ATEA + LTL + I]-1 b)}0.5. There are two (plus and minus) solutionsfor and may be regarded as the upper and lower resistivity boundsfor the specified qms if the elements of the projection operator b are set to unity.
Flow chart of the regularisedextremal bounds analysis process (Meju 2009)
The result of regularised 2D MT inversion served as the input. This is the best model obtained in a Least-squares sense. It is then subdivided into blocks for appraisal. • Most-squares model bounds are calculated for each block of the model for a specified threshold misfit of 10%, i.e., qms =qls1.1, with b values set to unity. Example of Most-squares model appraisal in regional-scale magnetotelluric (MT) resistivity imaging
Example of a simple application by Meju & Sakkas, JGR 2007 qms = qls1.1, with b values set to unity A. 2D Least-squares inversion model B. 2D Most-squares inversion model.
Appraisal of layered-earth models: Mapping regions inaccessible to a given data set(to prevent the over-interpretation of field data) - Synthetic MT amplitude and phase data (smooth-versus-rough-models) - COPROD MT field data (standard test) and effective depth of inference - Time-domain CSEM models and effective depth of inference Other applications of Most-squares method
lower envelope Upper envelope For high quality data, narrow solution envelopes are obtained by setting the elements of the projection vector ‘b’ to unity. That is, only two models are generated which are maximally consistent with the data. Most-squares solution envelopes for synthetic MT data (Meju & Hutton 1992) Model response covers the region spanned by error bars of the amplitude and phase data
For high quality data, narrow solution envelopes are obtained by setting the elements of the projection vector ‘b’ to unity. That is, only two extreme models are generated. Smooth solution envelopes for synthetic MT data (after Meju & Hutton 1992) Model response covers the region spanned by error bars of the amplitude data
Benchmark: Effective depth of inference (zone of structural concordance in pooled models) for COPROD MT data inaccessible region Region constrained by field data inaccessible region Smooth models are generated for a range of regularisation factors (0.05 to 0.8). The resulting pool of models share common features only when they are constrained by the field data. The models diverge (splay) at depths where the data fail to constrain them (Meju, 1988).
Region not constrained by field data Region not constrained by field data Most-squares class of extreme models for COPROD MT data Note that the Most-squares model diverge or splay where the models are poorly-constrained by the noisy field data.
Region not constrained by field data Optimal least-squares smooth- and rough-models for land time-domain CSEM data Conventional least-squares inversion of high-quality data leads to a single smooth- or rough-model
Region not constrained by field data Region constrained by field data Region not constrained by field data Comparison of effective depths from smooth models and direct-depth imaging for TEM data Models from inversion using two different regularisation factors, 0.01 and 0.5 Models from skin-depth of investigation
High quality field data; narrow solution envelopes obtained by setting the elements of the projection vector ‘b’ to unity. That is, only two extreme models are generated. Most-squares upper & lower solution envelopes for the time-domain CSEM field data Note that model responses cover the region spanned by data error bars
Extreme parameter sets are obtained by setting only one element of the projection vector ‘b’ to unity at a time, yielding 2M extreme models for the M model parameters. Most-squares class of extreme model parameters for the TEM data Note that model responses cover the region spanned by data error bars
Uncertainty visualisation in multiple dimensions: The search for a simple index of common structure! What are the common features in these 3 statistically equivalent 2D resistivity models? How can we measure ‘common structure’?
Is there a simple metric for presenting or visualizing uncertainty in inversion? • The geometrical attributes of extreme models from Most-squares inversion, and especially their degree of structural similarity, may be used as one quantitative measure of uncertainty (Meju,2009, GRL). • Let mp and mmbe the property fields for the Most-squares plus and minus solutions. • A criterion to apply is that the cross-products of the gradients of the mp and mm property fields must be zero at an important boundary or target zone. Simple Most-squares metric for interpreting uncertainty (Meju,2009)
If mp(x,y,z) denotes the vector field of the gradient of the model derived using the plus solution and mm(x,y,z) denotes the gradient of the model from the minus solution, we define the cross-gradients function t(x,y,z) = mp(x,y,z) mm(x,y,z). • The vector field of the cross-gradients function is • and t (x,y,z) = 0 implies structural similarity while departure from zero at any given location in the model (m(x,y,z)) may be taken as an interpretative measure of structural uncertainty at that location (Meju 2009). Simple Most-squares metric for interpreting uncertainty
Using mathematical methods to combine (disparate or correlated) measurements taken from different platforms so as to reconcile geoscientific conflicts or reduce interpretational ambiguities. • ‘Mathematics of conflict resolution’ requires realistic physical models! • Uncertainty quantification in large-scale geophysical inversion is a major challenge • Simple robust interpretation or visualization of uncertainty is not available! 4. Challenges & Way Forward
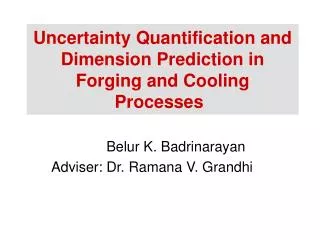
Directions for Future Research:1) Combining measurements of multiple physical phenomena (fields) to reduce model uncertainty2) Data homogenization: giving equal importance to the various data sources in in joint inversion of coupled-fields2) Methods for rapid computation of multiphysics fields4) Uncertainty analysis for large data sets: Monte Carlo covariance methods
Example: Joint cross-gradient inversion of electromagnetic resistivity and seismic travel-time data Reducing ambiguity by combining multiple physical phenomena (fields) Gallardo & Meju, 2003 GRL; 2004 JGR; 2007 GJI; 2011 RoG. Gallardo et al., 2005 Inv. Prob.
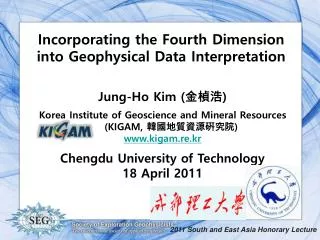
Test model and 2D grid design. Seismic ray coverage for the above synthetic test model. The inverted triangles mark the locations of the seismic shot-points. Simple metric of uncertainty in deep crustal imaging: Synthetic MT-seismic test – Gallardo & Meju 2007, GJI
Separate Joint inversion a) MT-resistivity model obtained by separate inversion. b) Seismic model obtained by separate inversion of the seismic data. c) MT-resistivity and d) seismic velocity models obtained by joint inversion using cross-gradients constraints. The thick lines outline the test structures that are the exploration targets (units A-F). Separate versus joint inversion results
Model appraisal: cross-gradient map of interpretational uncertainty Simple metric of uncertainty: Cross-gradient values are zero in areas well-constrained zones having common structure. It is non-zero in zones of conflicting subsurface structures.
5. Concluding comments: The outstanding challenges in uncertainty quantification are • Geological complexity and nonlinearity • Uncertainties in forward modelling of physical reality! Computational limitation • Fusing physical and non-physical data • Data homogenization (how to give equal-importance to various data sources!)
That’s all folks !Thanks for your kind attention ! Email: maxwell_meju@petronas.com.my Access pdfs of my publications at: http://www.es.lancs.ac.uk/giei/publications.htm
Useful references Gallardo, L.A. & Meju, M.A., 2011. Structure-coupled multi-physics imaging in geophysical sciences. Reviews of Geophysics, 49, RG1003, doi:10.1029/2010RG000330. Meju, M.A., 2009. Regularized extremal bounds analysis (REBA): An approach to quantifying uncertainty in nonlinear geophysical inverse problems. Geophys. Res. Letts., 36, L03304, doi:10.1029/2008GL036407.Meju, M. A. & V. Sakkas, 2007. Heterogeneous crust and upper mantle across southern Kenya and the relationship to surface deformation as inferred from magnetotelluric imaging, J. Geophys. Res., 112, B04103, doi:10.1029/2005JB004028.Meju, M.A., 1994. Biased estimation: a simple framework for parameter estimation and uncertainty analysis with prior data. Geophys. J. Int., 119,521-528.Meju, M.A., 1994. A general program for linear parameter estimation and uncertainty analysis. Computers & Geosciences, 20 (2), 197-220.Meju M.A. & Hutton, V.R.S., 1992. Iterative most-squares inversion: application to magnetotelluric data. Geophys. J. Int., 108, 758-766.