Decomposition Into Modules
The George Washington University School of Engineering & Applied Science Department of Electrical & Computer Engineering Decomposition, Time Estimation & Economic Analysis ( of Engineering Projects ) ECE-156 - Spring 2005 Profs. T. J. Manuccia, C. E. Korman,. Decomposition Into Modules.


Decomposition Into Modules
E N D
Presentation Transcript
The George Washington UniversitySchool of Engineering & Applied ScienceDepartment of Electrical & Computer EngineeringDecomposition, Time Estimation & Economic Analysis ( of Engineering Projects )ECE-156 - Spring 2005Profs. T. J. Manuccia, C. E. Korman,
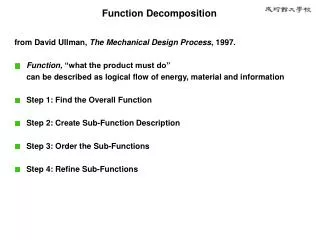
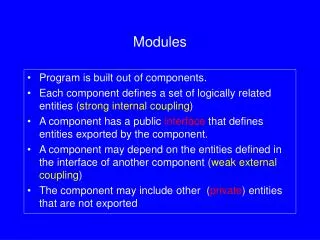
Decomposition Into Modules • You must subdivide your project into logically distinct modules. • Reasons: • Logical conceptualization & organization • Economic analysis • Time estimation • Examples of typical modules • I/O (hardware), I/O (software), Spectral Estimation (SW), Sensor System, RF Link, Power, User Interface Module, etc. • Hierarchical organization is common • Example: The project software is composed of numerous software modules
Decomposition Into Modules (cont’d) • Recursive decomposition is extremely useful • Example: • The overall project requirements force you to have both HW and SW modules (i.e., two level 1(L1) modules). • Your top level design of the HW module requires several lower level HW modules. (e.g., six L2 HW modules) • You write the requirements for each of the 6 L2 HW modules • You begin to design the L2 HW modules to meet these requirements, and realize that several of these need even lower level HW modules (ie, L3 HW modules) • You write the requirements for each of the L3 HW modules • You begin to design the L3 HW modules to meet these requirements, and realize … • Etc. etc. • Common (but not universal) definitions for the different module levels • Level 2 HW modules can be “sub-systems”, e.g., “the power sub-system”, “the RF sub-system” • Level 3 HW modules can be “boards”, e.g., “the transformer, rectifier and regulator boards” • Level 4 HW modules can be “circuits”, e.g., “the full wave rectifier and voltage doubler circuits on the rectifier board”, etc. • The Boolean union (sum) of all these modules must equal the entire project.
Development Phases (Each Module) • Each module of the project goes through the following phases (including the overall project): • Conceptualize and respond to external / higher level requirements with specifications (incl. interface specs.) • Design (i.e., the “internals”) • Construct • Test • Document • Integration • Redesign • Estimate the time required for each phase before the project begins. • Record the actual time required for each phase once the project starts.
Module-Phase Matrices(a.k.a., Module-Matrices) • Construct a matrix using the time data • One matrix per project module • One row per phase • Columns for estimated & actual times, percent complete • Example
Timelines (Gantt Charts) • Each phase of each module can usually be decomposed into numerous tasks. • Example: The construction of I/O board #1 can be broken down into PCB layout validation, fabrication, population, testing • Identify all milestones and critical paths/dependencies • Milestone Example: “Completion of Testing Plan” • Identification of dependency: “Testing of I/O board #1 can not be completed until the testing plan is complete.” • Critical path: A sequence of dependent lowest level activities having the longest overall duration, thereby determining the shortest time to complete the project. • The sequence of tasks that must get done on time otherwise the project will not be completed on time.
Timelines (Gantt Charts) • Learn to use Microsoft Project as a tool to manage your project’s tasks, costs, and scheduling / timeline. • Use Project to create Gantt charts for your project as a whole, for each task, for each deliverable, etc.
Economic Analysis • The economic analysis of an engineering project can be performed in numerous ways. • For ECE 156-7-8, we want you to estimate: • Cost to develop one or more prototypes • Cost for the production of a specified number of units • Packaging costs • Distribution costs • Estimated wholesale price (per unit only) • Estimated retail price (per unit only) • The first four costs above can be expressed as either: • Total, i.e., the total cost for all units produced • Per unit, i.e., total divided by the number of units produced.
Labor Costs Impact All Phases of Product Development • Technical personnel are needed for the development of the prototype. • They fall in different labor categories with different salaries: • Project Manager : $66/hr ( $132k /yr) • Design Engineer : $57/hr ( $114k /yr) • Hardware Engineer : $48/hr ( $ 96k /yr) • Software Engineer : $40/hr ( $ 80k /yr) • Test Engineer : $36/hr ( $ 72k /yr) • Technical Writer : $30/hr ( $ 60k /yr) • For simplicity in this classroom setting, we will explicitly consider ONLY the above labor categories in development of the prototype. • You will assume each of the above rolls as you work on your own project.
Salaries & Other Direct Costs Need To Be “Loaded” To Be Converted to “Cost to the Contract” (p.1) • Indirect costs: • Fringe benefits – Services or benefits provided to employees • Health Insurance, Payroll Taxes, Pension Contribution, Paid Absences, etc • Overhead – Costs associated with the performance of a project • Facility Costs (rent, heat, electricity, etc.) • General Laboratory Supplies, etc. • G&A - Costs associated with the overall management / administration of an organization • Office supplies and equipment • PC’s, Xexoxes, Fax machines, paper, etc. • Staff not directly charging to projects • Secretaries, top management & marketing personnel, etc. • Fee (i.e., built-in profit margin) • Cost of money (i.e., if money is borrowed to solve short term cash flow problems at the start of a project). • Estimated annual inflation on multi-year projects
Salaries & Other Direct Costs Need To Be “Loaded” To Be Converted to “Cost to the Contract” (p.2) • For the purpose of this class we will approximate the actual conversion from salary to contract charges by a single multiplier factor of 2.8. • Example: An employee with a $100/hr salary would charge the contract $280/hr • “The multiplier” ranges from ~2.0 to 3.3 in industry with higher numbers typically found in high tech or top-heavy consulting firms, lower numbers in production facilities. • “The multiplier” is considerably lower in academia, but one must be careful since the details of how different direct costs are loaded can be different from the commercial sector.
Prototype Cost • Calculate time and salary for each of the various labor categories • 3 Technical writers at $30/hour times 10 hours = $900 • 1 SW engineer at $40/hr times 100 hours = $4000 • Create totals for hours and for total salary • Total hours = 130 • Total salary = $4900 • Multiple your salary total by 2.8 to calculate how much these individuals will cost the contract • Labor charged to contract = $13,720 • Add the cost of all parts and external services needed to produce the final, pre-manufacturing prototype • Parts total = $1000 • Machine shop, PCB fabrication and population = $2000 • Total = $3000 • Add to this a 5% pass-through fee • 5% of $3000 = $150 • Add all of the above to calculate your prototype cost • Cost of labor = $13,720 • Cost of parts & external services = $3,150 • Prototype cost = $16,870 • IMPORTANT: In your deliverables & homework, present the your data and analogous computations in tabular form and show subtotals. • Note that the cost computation method outlined above is slightly different from that used in previous years.
Production Costs - Labor (p.1) • Note the different labor categories, salaries, and “multiplier” in a production environment versus in an engineering / development operation. • Manufacturing Process Development and Verification:Estimate total time, then multiple by a salary of $20/hr • Example: 100 hours mfg verification X $20/hr = $2000 • Software Testing: Estimate total time, then multiply by a salary of $15/hr • Example: 300 hours SW verification X $15/hr = $4500 • Use a multiplier of 2.0 for the above labor categories. • Example: Production labor cost = $6500 X 2.0 = $13,000
Production Costs – Non-labor (p.2 - continued) • Add the cost of parts in an appropriate quantity (eg, 1,000 units) for full scale production. • Example: Parts = $10/unit x 1,000 units = $10,000 • Note: Parts ordered in large quantities will be less expensive. • Estimate the costs of (a) printing the necessary documentation and (b) packaging for distribution. • Example: Printing & Packaging = $1/unit x 1000 units = $1000 • Note: $1/unit is intentionally wrong – It’s just a placeholder. • I want students to provide me with a better estimate of this number, & explain why theirs is better. • Sum the labor and non-labor production costs (above) • Add overhead costs of 40%, and then a profit (fee) of 20% • Example: ($13,000 + $10,000 + $1,000) x 1.4 x 1.2 = $40,320 • Express the cost of production in $ per unit. • Example: $40,320 / 1000 = $40.32 / unit
Estimation of Total Cost of The Project • Add together the cost of the prototype to the cost of production for the stated number of units to obtain the total cost of the project • Example: $16,870 + $40,320 = $57,190 • Also express the total cost of the project in dollars per unit • Example: $57,190 / 1000 = $57.19 / unit
Estimation of Minimum Wholesale and Retail PricesThe High Cost of Distribution • Start with total product cost per unit • Example: $57.19 / unit • Add 20% for wholesaler • Example: Wholesale price = $57.19 x 1.2 = $68.62 / unit • Add 50% for Retailer • Example: Retail price = $68.62 x 1.5 = $102.94 / unit • Note – The retail price is ~ 10x the price of parts!!!