Download
1 / 46
460 likes | 584 Vues
This paper discusses empirical relationships for snow characterization, including textural index, density, and thermal conductivity. It explores mechanical properties and micromechanical properties studied through the SnowMicroPenetrometer (SMP). The analysis highlights the importance of microstructural properties in predicting snow stability.

E N D
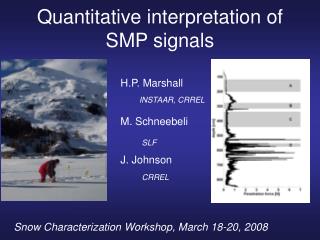
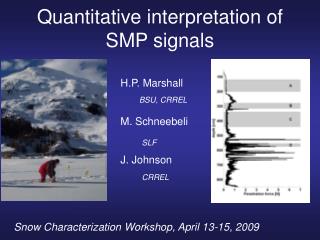
Quantitative interpretation of SMP signals H.P. Marshall M. Schneebeli J. Johnson BSU, CRREL SLF CRREL Snow Characterization Workshop, April 13-15, 2009
Emperical Relationships • Textural Index [Schneebeli, Pielmeier, Johnson, 1999, CRST] TI=1.45+5.72 CV
SMP hardness shows good agreement hand hardness profiles • Serial section shows similar boundaries and texture index trend makes sense
Emperical Relationships • Density [Pielmeier, 2003; Stahli et al, J Glac, 2003] Rho=55.6 * ln(mR)+317.4 [kg/m^3] [Marshall, 2005]
Emperical Relationships Thermal conductivity [Stahli et al, J Glac, 2003; Dadic, Schneebeli, Lehning, Hutterli, Ohmura, in press JGR ]
parameterization of thermal conductivity using penetration hardness
summit snow profile - top 0.5 m density shape size NIP SnowMicroPen
Summit Temperature 100 mm depth 300 mm depth Temperature measured Temperature simulated 1 mm layer resolution Temperature simulated 100 mm layer resolution
Summit temperature simulation simulation layer thickness 100 mm 1 mm
Hardness analysis • Spatial variability [e.g. Kronholm, 2003,…] • Temporal variability [Birkeland et al, 2004, Annals…] • Weak layer thickness [Lutz et al, 2005, CRST]
Similar features can be found in nearby profiles, and coincide with layer boundaries from manual profiles and radar measurements [Marshall, Schneebeli, Koh, 2007, CRST]
Mechanical Properties • Physics-based model [Schneebeli & Johnson, 98, Annals; Johnson and Schneebeli, 99, CRST] • Further improvements [Sturm et al, 04 (Manali); Marshall and Johnson, in review, JGR]
SnowMicroPenetrometer (SMP) • Micro-scale measurements (resolution = 0.004 mm) • Deflection and rupture of individual elements measured (Johnson and Schneebeli, 1999)
Basic structural element [Johnson and Schneebeli, 99, CRST]
Multiple structural elements simultaneously engaged with SMP tip
Simulated signal shows similar structure to field measurements
Micromechanical properties • Mechanical properties are very sensitive to errors in basic microstructural properties
Improvement to physical theory • Removed assumption of uniform random distribution of elements [Sturm et al, Manali, 2004]
Used Monte-Carlo to simulate signals, applied theory, and made modifications to improve accuracy • Overlapping ruptures • Solve exactly for delta • Remove increase in force during rupture (digitization) • Include all force values in calculation
Real data is noisy, includes force variations not due to ruptures • Rupture force threshold [Johnson and Schneebeli, 99] • Rupture slope threshold [Kronholm et al] • Air signals typically have ruptures ~0.01N
Resulting microstructural parameters are sensitive to snow type
Macro scale mechanical properties important for modeling stress on slope
Comparison SMP and traditional stability tests [Pielmeier and Marshall, ISSW 2008]
Classification of stability based on SMP analysis 88% total accuracy, 87% stable accuracy, 89% unstable accuracy
Testing changes in strength with increased load [Lutz et al, ISSW 2008]
Strength estimates agree with stability tests • Decrease in strength with increasing load
Conclusions • Major sources of error in micro-mechanical analysis corrected • Retrieval of parameters from simulated signals accurate over wide range of parameters • Analysis applied to field studies show stability can be classified based on parameters with 88% accuracy • Provides new rapid method for studying spatial variability of snowpack stability