Download
1 / 24
240 likes | 364 Vues
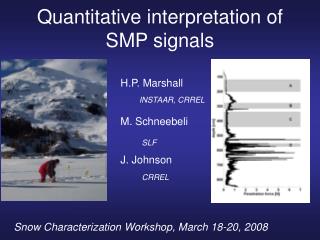
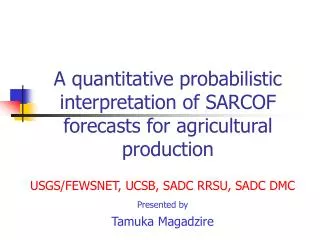
A quantitative probabilistic interpretation of SARCOF forecasts for agricultural production . USGS/FEWSNET, UCSB, SADC RRSU, SADC DMC Presented by Tamuka Magadzire. Outline. Objective Background FACT – probability and rainfall amounts Crop Water Requirements Example study for FMA 2003

E N D
A quantitative probabilistic interpretation of SARCOF forecasts for agricultural production USGS/FEWSNET, UCSB, SADC RRSU, SADC DMC Presented by Tamuka Magadzire
Outline • Objective • Background • FACT – probability and rainfall amounts • Crop Water Requirements • Example study for FMA 2003 • Future work
Objective COF forecast p(crop success) • To generate a crop-specific interpretation of the COF forecasts
Background • Analysis based on two concepts • Analysis of the relationship between probability and rainfall amounts • Enabled by the FEWSNET AgroClimatology Toolkit (FACT) • Crop water requirements, and their relationship with yield • Derived from Water Requirements Satisfaction Index (WRSI) analysis
Probability Distribution Function • Bar chart gives indication of frequency of events • Can be used to construct derive probabilities Increasing quantity
Probability Distribution Function • Area under the curve equals probability of an event falling within a range of values • We can model the rainfall distribution using a pdf with appropriate parameters. This pdf can be used to completely describe the rainfall distribution, and the probability of rainfall of different amounts.
Probability Distribution Function • Has been shown to perform well for rainfall • Never less than zero • Can be very flexible in form • Described by only 2 parameters – shape and scale • We use Gamma Distribution rather than normal distribution because:
Probability-Accumulation Relationship • Fitting a probability distribution to rainfall events at a location allows for the querying of the likelihood of a particular event • Similarly, the amount of rainfall corresponding to a particular likelihood can be derived
Finding Probability • Use x-axis to locate the rainfall accumulation of interest • Trace up until it meets the curve • Trace left to find the probability of being less than the amount
Finding Rainfall • Use the y-axis to find the likelihood of interest • Trace right to the curve • Trace down to find the accumulation associated with the likelihood
Obstacle • How can a relationship between historical data and forecast probabilities be made? • Is it possible to make a meaningful connection between forecasts and accumulations?
33% 33% 33% Drawing From Terciles • Hypothetical forecast for the region calls for 45/35/20 • Draw user-defined number of samples randomly from theoretical terciles in proportion to forecast • New distribution parameters calculated DRY MID WET 20 35 45
Old v New Distribution • Old shape: 2.59 • Old scale: 13.64 • New shape: 3.12 • New scale: 13.04 • New distribution reflects lower probability of dryness and increased wetness
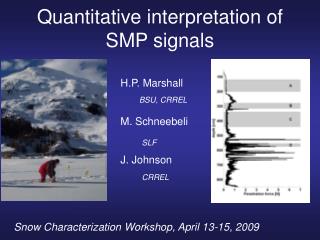
Growth and Development of a Maize crop Development –change in phenological stage 3 Growth-change in size; Water Requirement 4 Most critical stages of maize 2 2 1 Est Veg Tass Silk Yld Rip Days 15-25 25-40 15-25 35-40 10-15 15-25 40-65 55-85 90-130 100-145 Water Requirements
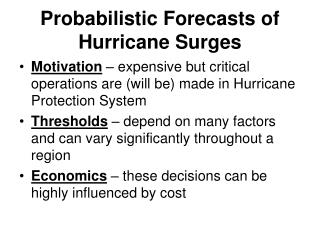
Crop Water Balance PPTi ETi Runoff Surplus ET = WR (Water Requirement) SWi WHC ET < WR Drainage SWi = SWi-1 + PPTi - ETi
Water requirements satisfaction index • Based on water balance model. WRSI correlates well to yield in water-limited areas.
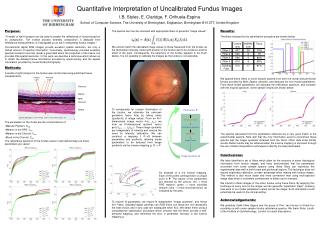
Examples • Climatological probability of exceedence of 80% of Water Requirements for (a) 120-day maize and (b) 90-day sorghum in JFM
Future work • Incorporating cropping areas into forecast • Producing a single crop forecast for most major cereal crops • Interpreting the SARCOF-7 forecast, and future COF forecasts in similar manner