Testing V-A in Top Quark Decay at CDF: Run I & II Insights and Future Expectations
This document discusses the research conducted on V-A interactions in top quark decays at the CDF detector. Utilizing top quark behavior, the study explores methods to search for V+A, and presents results from Run I alongside expectations for Run II. Emphasis is placed on the top quark's unique role in electroweak symmetry breaking, its interactions, and decay channels. The analysis also considers statistical uncertainties and systematic errors while highlighting the importance of obtaining precise measurements regarding non-standard weak interactions at the Fermilab Tevatron.

Testing V-A in Top Quark Decay at CDF: Run I & II Insights and Future Expectations
E N D
Presentation Transcript
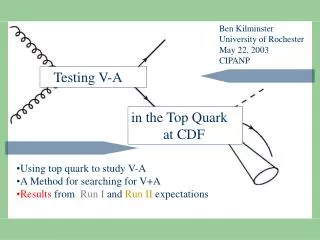
Ben Kilminster University of Rochester May 22, 2003 CIPANP Testing V-A in the Top Quark at CDF • Using top quark to study V-A • A Method for searching for V+A • Results from Run I andRun II expectations
Top Yukawa Coupling to the Higgs field ~ 1 • In terms of the electroweak force, top is the only natural quark • Special Role in electroweak symmetry breaking ?
Chicago Booster CDF DØ Tevatron p source Main Injector (new) Fermilab Tevatron Upgrade Wrigley Field • New Main Injector: • Improve p-bar production • Recycler ring: • Reuse p-bars
The CDF detector for Run II • CDF II: • 8 layers of silicon • New drift chamber (COT) • Extended lepton-ID:|h|>1
ttbar production at the Tevatron • Mttbar= 350 GeV, ETev = 1960 GeV • Momentum fraction needed: x ~ 0.2 500 ttbars produced Run I 90% 10%
b Top decays exclusively via weak interaction (100%) t-> W + b (Vtb~1) l- n l+ b n b q q b n l- q b q q q b Top Decay channels Top lifetime 1/(Vtb2*M3) ~ 10-24 Time for QCD confinement ~ λQCD~10-23s • Top most likely decays before hadronizing • All-Hadronic W’s decay hadronically 2 b jets 4 other jets • Lepton + Jets One hadronic W decay 1 High Pt lepton (e or μ) 2 b jets 2 other jets Missing Et • Dilepton W’s decay leptonically 2 High Pt leptons (e,μ) 2 b jets Missing Et 30% 45% 5%
Physics of W helicity from top decay This analysis studies this 30%
Using cosΨ*l M2lb = ½ (M2T – M2W)(1 + cosΨ*l) V-A : 30% left-handed 70% longitudinal V+A : 30% right-handed 70% longitudinal
Event samples Chosen to minimize M2lb combinatorics and backgrounds • 3 ttbar sub-samples used from Run I (109 pb-1) • Dilepton e/mu 7 events (bkg 0.76) • b-jets are chosen as highest two Et jets in event • SVX double tagged l+j 5 events (bkg 0.2) • SVX single tagged l+j 15 events (bkg 2.4) • Standard top cuts applied (CDF top mass selection for all samples) • Sub-samples fit in combined likelihood to MC templates of V+A top, V-A top, and backgrounds
DileptonComparing M2l+b [GeV2] distribution shapesV-A, V+A, backgrounds CDF Run I Preliminary Background contribution Z->tau+tau- 51 % WW 27 % W+jets fake 22 % Black line denotes Physical region for Correct pairings
Top mass and jet energy scale systematics • If jet energy scale high, real top mass is low • Without correlation: • Top mass systematic: 0.21 • Jet energy scale systematic: 0.14 • With correlation: • Top mass systematic: 0.19 • Jet energy scale systematic: 0.04 World top mass: 174.3 ± 5.1GeV CDF l+j top mass: 175.9 ± 4.8 (stat) ± 5.3 (sys) GeV of sys: 4.4 GeV is due to jet energy scale
Approaches for assigning confidence levels tofV+A = -0.21 +0.42-0.25(stat) ±0.21 (sys) • Neyman construction for confidence level • Simulate multiple “pseudo-experiments” to obtain spread of measurements for a range of values of ftrue • Fold in systematic uncertainty into each pseudo-result • Ignore whether each pseudo-result is physical or not • For each ftrue , calculate lower limit such that 95% of measurements would be greater than limit • Find fV+A such that the limit corresponds to the measurement
Neyman Confidence Level of measurement CDF Run I Preliminary fV+A < 0.80 @ 95% CL
Run 2 Expectations • Statistical uncertainties using event yields from CDF run 2 A TDR • Backgrounds contribution considered same as Run I • Systematic uncertainties estimated from Tev2000 report • Correlation between top mass and jet energy scale uncertainties calculated assuming CDF top mass measurement in 2 fb-1
The “Gamma 5 Brothers” Result: How much does V+A weigh in ? fV+A=-0.21 +0.42-0.25 (stat) ±0.21 (syst) fV+A < 0.80 @ 95% C.L. CDF I preliminary
Conclusions • Searching for non-Standard weak interactions of top as a hint that top is important to the weak interaction itself. • Result is consistent with Standard Model and in fact excludes (to greater than 95% CL) the possibility of a right-handed tWb coupling • In Run II, this technique will be used to make a precise measurement