GPS for NOAA Hydrographic Surveying
390 likes | 794 Vues
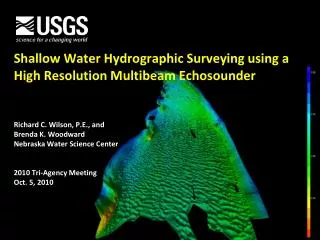
CDR Gerd F. Glang & Jack L. Riley National Ocean Service, NOAA. GPS for NOAA Hydrographic Surveying. NOAA GNSS Workshop 2007. Introduction. NOAA Charting NOAA Hydrographic Surveying GPS Positioning Vertical Datums Concluding Remarks. NOAA’s Charting Mission. Safety of Navigation

GPS for NOAA Hydrographic Surveying
E N D
Presentation Transcript
CDR Gerd F. Glang & Jack L. Riley National Ocean Service, NOAA GPS for NOAAHydrographic Surveying NOAA GNSS Workshop 2007
Introduction • NOAA Charting • NOAA Hydrographic Surveying • GPS Positioning • Vertical Datums • Concluding Remarks
NOAA’s Charting Mission • Safety of Navigation • Provide nautical charts and related hydrographic information for safe navigation of maritime commerce • Includes U.S. territorial waters and the U.S. Exclusive Economic Zone (EEZ) • 3.4 million square nautical miles (snm) which extend 200 nautical miles offshore • 500,000 snm Navigationally Significant Areas • 43,000 snm Critical Areas (1994) • High-quality charts depend on up-to-date, reliable hydrographic survey data
NOAA GNSS Workshop 2007 • NOAA Charting • NOAA Hydrographic Surveying • GPS Positioning • Vertical Datums • Concluding Remarks
Hydrographic Surveys • Locate, Verify, Describe... • Features Below Mean High Water (MHW) • Dangers-to-Navigation (DTONs) • Aids to Navigation • MHW Shoreline • Echosounder Bathymetry • Side Scan Sonar Imagery • Dive Investigations • Bottom Samples • Shoreline • Metadata
Equipment • GPS & Platform Attitude • Applanix POS MV 320 v4 • Trimble DGPS, C-NAV WADGPS/PPP • Multibeam Echosounders / Backscatter • Reson 8101, 8111, 8125, 8160, 7125 • Elac 1050 & 1180 • Simrad 1002, 3000 • Airborne laser (or lidar) bathymetry • Optech • LADS • Side Scan Sonar • Klein 3000 & 5000 Systems • Phase Differencing (Interferometric) Sonars • Benthos C3D evaluation in AK during 2007 • Klein 5410 • Geoacoustics • Autonomous Underwater Vehicle (AUV) • REMUS Hydroid w/ Kearfott T-16 • Vessel-based Laser Scanner for shoreline delineation • Experiment completed in VA during 2007
Gridded Bathymetry / Stats Depth: uncertainty-weighted depth-most probable surface Uncertainty: uncertainty-weighted uncertainty Density: number of soundings that contributed to grid node Standard Deviation: standard deviation of the soundings that contributed to grid node Mean: “regular” average of the soundings that contributed to grid node Shoal: shoalest of soundings contributing to grid node Deep: deepest of soundings contributing to grid node
Positioning Requirements • Horizontal Accuracy (95%) • IHO S-44 Order 1: 5 meters + 5 percent of depth • Vertical Accuracy (95%) • IHO S-44 Orders: ± [a2 + (b × depth)2]½ • Order 1: Depth ≤ 100 m a = 0.5 m, b = 1.3% • Order 2: Depth > 100 m a = 1.0 m, b = 2.3% • Special Order: a = 0.25 m, b = 0.75% • Resolution • Complete Coverage – Detect Shoals: • Depth ≤ 40 m 2-m x 2-m horizontal, 1-m vertical • Depth > 40 m 10% depth horizontal, 5% depth vertical • Object Detection Coverage: • Depth ≤ 20 m 1 m3 • Depth > 20 m (5% depth)3
Non-GPS Vertical Positioning • Corrections from in-situ water level • High frequency (< 20s periods) via IMU heave • Medium frequency via dynamic draft model* • Low frequency via (> 3600s periods) zoned tides
Surveying On The Ellipsoid • 3-D position of vessel body related directly to a fixed coordinate system (ellipsoid datum) • No dynamic draft look-up table (biases) • Spectral combination of GPS height with inertial measurement unit (IMU) heave • Tidal zoning corrections replaced by vertical datum transformation • Real-time vs. post-processed solution
Non-3D Positioning 50 cm pixels
3-D Positioning 50 cm pixels
Vertical Datum Transform Ellipsoidal height MLLW depth is best achieved as a combination of stepwise transformations ITRF97 (1997.0) NAD 83 (86) NAD 83 (86) NAVD 88 NAVD 88 LMSL LMSL MLLW Each transformation step utilizes the best available theory and data
WGS 84 (G873) ITRF2000 WGS 84 (G1150) MHHW WGS 84 (G730) WGS 84 (orig.) ITRF97 MHW NGVD29 ITRF96 ITRF94 MTL ITRF93 NAD83 (NSRS) NAVD 88 LMSL ITRF92 ITRF91 DTL GEOID99, GEOID03 ITRF90 TSS (Topography of the Sea Surface) ITRF89 MLW ITRF88 SIO/MIT 92 NEOS 90 MLLW PNEOS 90 3-D Datums Orthometric Tidal Datums Datums VDatum Transforms
Tidal Datum Fields K2 Tide • Global tide models provide boundary conditions to regional model 2. Regional model computes elevation time series and tidal datums are computed based on analysis of these time series and adjusted to fit NOS tidal gauge datums 3. In bays TCARI is used to interpolate between differences in the regional model and the observed datums
Modeled Tidal Datum Fields VDatum Marine Grid Datum transformations also provided on regularly structured grids to VDatum: • Topography of the Sea Surface (NAVD88 – to – LMSL field): spatially interpolated using benchmark data and a minimum curvature algorithm. • VERTCON transformations between NAVD88 and NGVD29 • GEOID models • NADCON horizontal datum transformations. VDatum Marine Grid
VDatum Available Dec 2007 Oct 2008 VDatum: West Coast Puget Sound North/Central California
VDatum Available Oct 2007 Oct 2008 VDatum: Gulf Coast Lake Charles Port Fouchon Tampa Bay VDatum exists 2007 2008
VDatum: East Coast Delaware Bay New York Bight North Carolina VDatum Available Oct 2007 Oct 2008 Tidal Model Complete (waiting on geodetic ties)
Conclusion • Goal: All “surveying on the ellipsoid” by 2010 • Implementation plan due 3rd QTR 2008 • PPK & PPK-aided inertial on the ship • Data acquisition & processing with QA • Vertical solution 100% availability within error budget • Maximize use of CORS • VDatum to reduce soundings to MLLW (chart datum) • RTK? (need QA) • PPP when requirements allow (water depth) • GPS buoys to validate VDatum modeling • Augmentation & Hybrid GNSS?