Hyperspectral Sensing: Analysis and Applications in Remote Sensing
250 likes | 422 Vues
Hyperspectral sensing offers detailed information by capturing spectral bands, allowing for precise identification and mapping of materials such as minerals and crops. The technology enables in-depth analysis through comparison to field-measured spectra, aiding in various applications such as river monitoring and mineral detection.

Hyperspectral Sensing: Analysis and Applications in Remote Sensing
E N D
Presentation Transcript
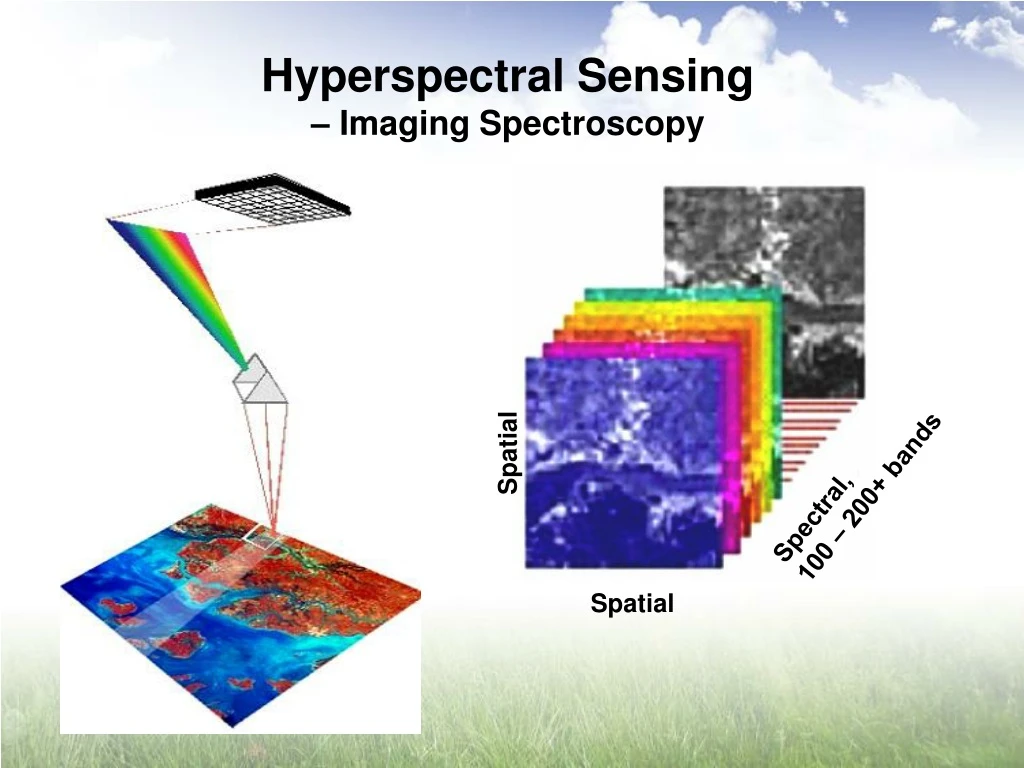
Spatial Spectral, 100 – 200+ bands Spatial Hyperspectral Sensing – Imaging Spectroscopy
Y Z = Spectral Bands X Data Cube – a way to visualize the data
Multispectral Hyperspectral Each pixel Discrete bands Continuous spectrum Reflectance Reflectance Wavelength Wavelength
Multispectral vs. Hyperspectral Data Multispectral, e.g., Landsat TM Hyperspectral, e.g., AVIRIS Reflectance Wavelength
Diagnostic / identifying characteristics are lost in wide bands Spectra of two materials with (very) different reflectance and absorption properties. If sensed with a wide band, Reflectance they will have the same response and cannot be discriminated or identified. Wavelength
Reflectance Wavelength Analysis of Hyperspectral Data -- Approaches • Direct identification using diagnostic absorption and reflection features • Comparison to laboratory and field measured spectra
Crop Identification and Inventory based solely on the spectra
Reflectance Spectra of Minerals Relative Reflectance Wavelength, μm
Reflectance Wavelength, μm Mineral Detection and Mapping
Mineral Maps from Hyperspectral Data True Color Image
River Airborne Hyperspectral Remote Sensing 5.5 5 4.5 Confluence of 4 Reflectance % 3.5 Minnesota and 3 Mississippi 2.5 Rivers 2 1.5 400 500 600 700 800 900 Wavelength (nm) University of Minnesota, Remote Sensing Lab and Water Resources Center
Hyperion On E0-1 (NASA) satellite 220 bands, 0.4 – 2.5 μm 12-bit radiometric resolution 30 m spatial resolution 7.5 km swath (= narrow) Satellite Hyperspectral Sensors
Reflectance Wavelength, μm Summary • Hyperspectral sensing and analysis provides increased information compared to multispectral data • A fast growing technology - New sensors, new classification algorithms, and new image processing algorithms are being developed • Applications are being developed as the technology develops


