Download
1 / 29
290 likes | 319 Vues
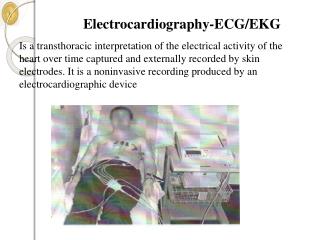
Learn how to recognize a normal ECG tracing, calculate heart rate, determine rhythm, and understand vectorial analysis principles for EKG interpretation. Explore ECG deflection waves and heart axis deviations.

E N D
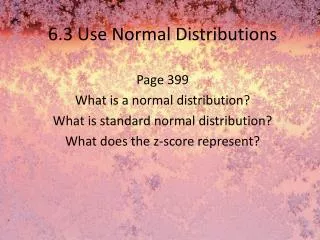
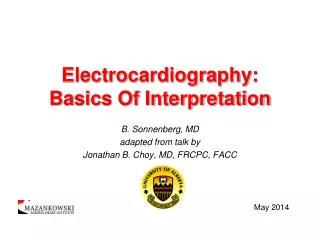
Electrocardiography – Normal6 Faisal I. Mohammed, MD, PhD
Objectives • Recognize the normal ECG tracing • Calculate the heart rate • Determine the rhythm • Calculate the length of intervals and determine the segments deflections • Draw the Hexagonal axis of the ECG • Find the mean electrical axis of QRS (Ventricular depolarization)
Principles of Vectorial Analysis of EKG’s • The current in the heart flows from the area of depolarization to the polarized areas, and the electrical potential generated can be represented by a vector, with the arrowhead pointing in the positive direction. • The length of the vector is proportional to the voltage of the potential. • The generated potential at any instance can be represented by an instantaneous mean vector. • The normal mean QRS vector is 60o (-30◦ - 110◦)
+ + + + + + + + + + + + + + + + + + + + + + + + + + + + + + + + + + + + + + + + + + + + + + + + + + + + Mean Vector Through the Partially Depolarized Heart _ _ _ _ + + _ _ + _ _ + _ _ _ + _ _ _ + _ _ _ _ _ + + _ _ _ + _ _ _ _ _ + _ _ _ _ _ _ _ _ _ _ _ _ _ _ _ +
Einthoven’s triangle and law + + +
Axes of the Three Bipolar and Augmented Leads aVF _ _ _ II III aVL aVR + 210o -30o + I I 0o _ + _ 60o aVR aVL _ 120o 90o II + III + aVF + Principles of Vectorial Analysis of EKG’s (cont’d)
Axes of the Unipolar Limb Leads I + + aVL aVR - aVF +
Principles of Vectorial Analysis of EKG’s (cont’d) • The axis of lead I is zero degrees because the electrodes lie in the horizontal direction on each of the arms. • The axis of lead II is +60 degrees because the right arm connects to the torso in the top right corner, and left leg connects to the torso in the bottom left corner. • The axis of lead III is 120 degrees.
Principles of Vectorial Analysis of EKG’s (cont’d) • In figure B, the depolarization vector is large because half of the ventricle is depolarized. • Lead II should be largest voltage when compared to I and III when the mean vector is 60o. • In figure C, left side is slower to depolarize. • In figure D, the last part to depolarize is near the left base of the heart which gives a negative vector (S wave). • Q wave is present if the left side of the septum depolarizes first.
The T Wave (Ventricular Repolarization) • First area to repolarize is near the apex of the heart. • Last areas, in general, to depolarize are the first to repolarize. • Repolarized areas will have a + charge first; therefore, a + net vector occurs and a positive T wave
Atrial Depolarization (P-Wave) and Atrial Repolarization (Atrial T Wave) • Atrial depolarization begins at sinus node and spreads toward A-V node. • This should give a + vector in leads I, II, and III. • Atrial repolarization can’t be seen because it is masked by QRS complex. • Atrial depolarization is slower than in ventricles, so first area to depolarize is also the first to repolarize. This gives a negative atrial repolarization wave in leads I, II, and III
Vectorcardiogram • This traces vectors throughout cardiac cycle. • When half of the ventricle is depolarized, vector is largest. • Note zero reference point, number 5, is point of full depolarization.
Plot of the Mean Electrical Axis of the Heart from Two Electrocardiographic Leads III _ -60o I _ + I I II 180o 0o III 60o + 120o III
aVF SEVERE RIGHT OR LEFT AXIS DEVIATION OF QRS From 180 to 360 (-90) 90◦ LEFT AXIS DEVIATION OF QRS Lead I Lead I + 180◦ 0◦ NORMAL MEAN ELECTRICAL AXIS OF QRS From 0 to +90 RIGHT AXIS DEVIATION OF QRS From +90 to + 180 +90◦ aVF +
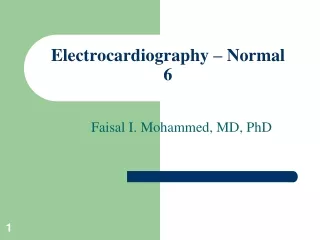
Heart Rate Calculation • R-R interval = 0.83 sec • Heart rate = (60 sec)/(0.83 sec) = 72 beats/min min beat
Determine regularity • Look at the R-R distances (using a caliper or markings on a pen or paper). • Regular (are they equidistant apart)? Occasionally irregular? Regularly irregular? Irregularly irregular? Interpretation? R R Regular
ECG Deflection Waves Atrial repolarization (Pacemaker)
ECG Deflection Waves 60 seconds ÷ 0.8 seconds = resting heart rate of 75 beats/minute 1st Degree Heart Block = P-Q interval longer than 0.2 seconds.
ECG Deflection Wave Irregularities Enlarged QRS = Hypertrophy of ventricles
ECG Deflection Wave Irregularities Prolonged QT Interval = Repolarization abnormalities increase chances of ventricular arrhythmias.
ECG Deflection Wave Irregularities Elevated T wave : Hyperkalemia
ECG Deflection Wave Irregularities Flat T wave : Hypokalemia or ischemia