Download
1 / 19
190 likes | 309 Vues
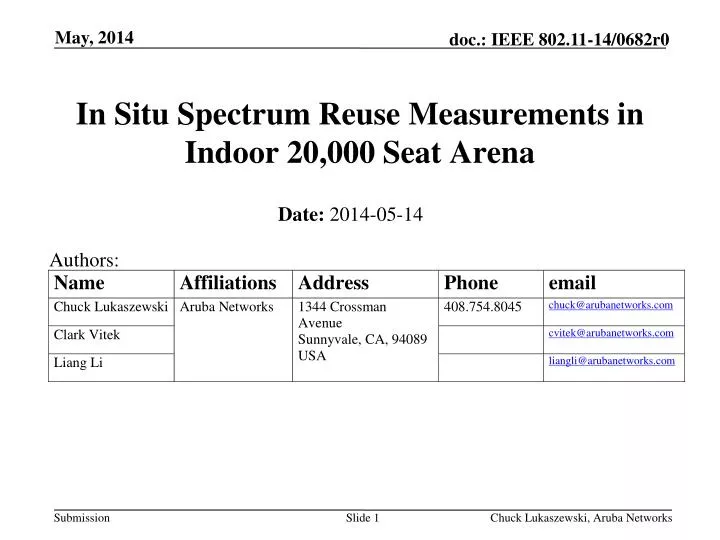
In Situ Spectrum Reuse Measurements in Indoor 20,000 Seat Arena. Date: 2014-05-14. Authors:. Abstract. Very high-density (VHD) environments such as outdoor stadiums and indoor arenas are poorly characterized .

E N D
Chuck Lukaszewski, Aruba Networks In Situ Spectrum Reuse Measurements in Indoor 20,000 Seat Arena Date:2014-05-14 Authors:
Chuck Lukaszewski, Aruba Networks Abstract • Very high-density (VHD) environments such as outdoor stadiums and indoor arenas are poorly characterized. • Repeatable in situ measurements are difficult to obtain. Channel reuse measurements are even harder to obtain. • Available macro usage statistics from multiple vendors show significant underutilization as compared with AP count, suggesting spatial reuse is rarely achieved. • 802.11hew SG has done some work on modelling [1, 2] • This contribution presents recent in situ reuse measurements at large indoor basketball arena in USA
Chuck Lukaszewski, Aruba Networks System Overview • Seating capacity: ~20,000 • Association capacity target: 25% (~5,000 assns) • Active capacity target: 1MB / client / 5 min session • WAN Uplink: 150Mbps • Total APs: 294 (~100 in bowl) • RF Coverage Strategy: Overhead (3 tiers) • Bowl Antenna Pattern: 30ºH x 30ºE, H/V dual pol • Channel Set & Width: Non-DFS, 20MHz • Avg APs per Channel: 10 in bowl • TX Rates (5GHz): 18, 24, 36, 48, 54
Chuck Lukaszewski, Aruba Networks Usage Statistics – Typical Non-Playoff Night • 151.9GB over 240 minutes • 84.3Mbps average • 120.7% of association capacity target • 300% of active user target • 8.1 sessions per client • Average SNR = 23.26dB
Chuck Lukaszewski, Aruba Networks Band Breakdown – Typical Non-Playoff Night
Chuck Lukaszewski, Aruba Networks Test Configuration & Procedure • We created 2 AP groups: • “Upper” group fixed to ch 44 • “Lower” group fixed to ch157 • Hidden SSID to force association • Test devices: • Galaxy S4 (1SS 11ac) • Galaxy Tab Pro 12.2 (2SS 11ac) • IxChariot 7.3EA SP1 • Test methodology: • Baseline each section (find “X”) • Run 2 sections at a time • Run all sections at a time • Repeat for each device • Repeat for both levels / groups
Chuck Lukaszewski, Aruba Networks Baseline – Single Section Results • Pre-Game • 2SS tablet yields 1.9X the goodput of the 1SS phone • Performance is consistent across device & location • Upstream consistently beats downstream, but delta varies with bowl level and device type • Average delta is 8Mbps for GS4 on both levels • For tablet, there is an 11Mbps delta on the floor but almost 20Mbps delta in upper bowl • In Game (2ndQtr) • Downstream goodput drops by ~70% downstream for both devices • Upstream goodput drops by 49% for GS4 and 67.6% for Tablet • No point in testing lower bowl
Chuck Lukaszewski, Aruba Networks Reuse Tests – Lower Bowl (Pre-game) • No spatial reuse in lower bowl • GS4 2 section was 59.8% / 82.6% of baseline (down/up) • Tablet 2 section was 94.3% / 98.8% of baseline (down/up) • Tablet 4 section dropped to 67% / 56% of baseline (down/up) • Result consistent with prevalent low-rate OBSS CCI • No point in running in-game reuse tests
Chuck Lukaszewski, Aruba Networks Reuse Tests – Upper Bowl (Pre-game) • Limited spatial reuse observed for GS4: • 2 section concurrent: n=1.5X(n is goodput multiple over X) • 4 section concurrent: n=1.8X • Little to no reuse seen for 2 section tablet tests • Limited reuse observed for 4 section tablet test (n=1.9X) • Magnitude of effect is geometry dependent
Chuck Lukaszewski, Aruba Networks Reuse Tests – Upper Bowl (In Game) • Reuse factor increased significantly with crowd • GS4 2 section concurrent: n=1.9X down / 1.3X up • GS4 3 section concurrent: n=2.8X down / 2.5X up • Tablet 2 section concurrent: n=1.6X down / 2.2X up • Tablet 3 section concurrent: n=3.2X down / 4.0X up
Chuck Lukaszewski, Aruba Networks Explanation / Hypothesis • To achieve spatial reuse, both of these must be true: • There must be sufficient BSS-BSS main lobe rejection.From the cross section below it’s easy to see how this would be true of the upper level but not the floor. • There must be sufficient client-to-client cross-bowl rejection. Combination of distance, body attenuation and overall crowd effect. MRC on multi-SS clients reduces rejection. • “Sufficient” means adequate to avoid PLCP preamble detection (e.g. SNR = 4dB) • For this arena, upper bowl with back-tilted narrow beamwidth antennas has good rejection • The lower bowl has little or no rejection
Chuck Lukaszewski, Aruba Networks Main Lobe vs. Cross-Bowl Rejection
Chuck Lukaszewski, Aruba Networks Typical Measured Cross-Bowl SNR
PLCP Interference Radius 80m 160m 20m 40m Preamble Continues to 4 SNR and >250m !!!! • Cell Edge Radius(r1) • This is what we usually call the “cell edge” of the AP • It is the target data rate radius (e.g. -67dBm = MCS15 or 54Mbps) • Interference Radius (r2) • 802.11 preamble can be decoded (SNR >= 4dB) r 2r 4r 8r -83dBm 7 SNR -71dBm 19 SNR -65dBm 25 SNR -77dBm 13 SNR
Chuck Lukaszewski, Aruba Networks Areas of Future Study • Having established cross-bowl reuse, what is the minimum lateral (side-to-side) section distance for reuse? • What about reuse in a single section from floor all the way to ceiling (single “slice”)? • Explore further main floor reuse. • How to automate and permanently embed instrumentation
Chuck Lukaszewski, Aruba Networks References • https://mentor.ieee.org/802.11/dcn/14/11-14-0381-00-0hew-stadium-scenario-for-hew.ppt • https://mentor.ieee.org/802.11/dcn/13/11-13-1079-00-0hew-outdoor-stadium-simulation-details-discussion.pptx