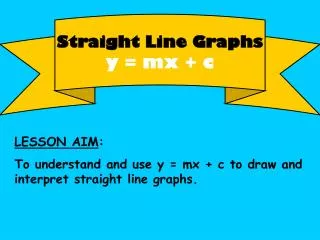
Straight Line Graphs
Straight Line Graphs. Straight Line Graphs. Sections 1) Horizontal, Vertical and Diagonal Lines (Exercises) 2) y = mx + c ( Exercises : Naming a Straight Line Sketching a Straight Line ) 3) Plotting a Straight Line - Table Method (Exercises)

Straight Line Graphs
E N D
Presentation Transcript
Straight Line Graphs Sections 1)Horizontal, Vertical and Diagonal Lines (Exercises) 2)y = mx + c (Exercises : Naming a Straight Line Sketching a Straight Line) 3)Plotting a Straight Line - Table Method (Exercises) 4)Plotting a Straight Line – X = 0, Y = 0 Method (Exercises) 5) Supporting Exercises Co-ordinatesNegative NumbersSubstitution
4 3 2 1 -5 -4 -3 -2 -1 0 1 2 3 4 5 -1 -2 -3 -4 -5 y Naming horizontal and vertical lines (x,y) (3,4) (3,1) x y = -2 (-4,-2) (0,-2) (-4,-2) (3,-5) x = 3 Back to Main Page
4 3 2 1 -5 -4 -3 -2 -1 0 1 2 3 4 5 -1 -2 -3 -4 -5 y Now try these lines (x,y) (-2,4) y = 2 (-2,1) x (-4,2) (0,2) (-4,2) (-2,-5) x = -2 Back to Main Page
(x,y) y See if you can name lines 1 to 5 x = 1 x = 5 4 x = -4 3 2 y = 1 1 1 x -5 -4 -3 -2 -1 0 1 2 3 4 5 -1 -2 -3 y = -4 4 -4 -5 5 2 3 Back to Main Page
(x,y) 4 3 2 1 -5 -4 -3 -2 -1 0 1 2 3 4 5 -1 -2 -3 -4 -5 y = x + 1 y Diagonal Lines y = x (3,3) (-3,3) (-1,1) (1,1) x (2,-2) (-3,-3) (-4,-3) (0,1) (2,3) y = -x Back to Main Page
4 3 2 1 -5 -4 -3 -2 -1 0 1 2 3 4 5 -1 -2 -3 -4 -5 y y = x + 1 Now see if you can identify these diagonal lines 3 y = x - 1 y = - x - 2 x y = -x + 2 4 1 2 Back to Main Page
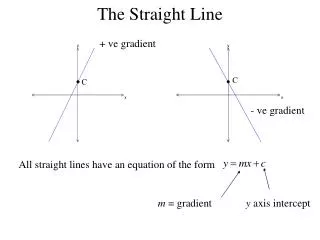
y = mx + c Every straight line can be written in this form. To do this the values for m and c must be found. c is known as the intercept y = mx + c m is known as the gradient Back to Main Page
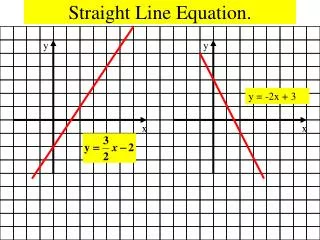
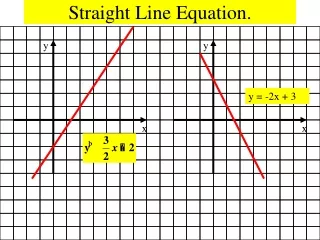
8 7 6 y 5 4 3 2 1 1 2 3 4 5 6 7 8 –7 –6 –5 –4 –3 –2 –1 -1 -2 -3 -4 -5 -6 x Finding m and c Find the Value of c This is the point at which the line crosses the y-axis. So c = 3 Find the Value of m The gradient means the rate at which the line is climbing. Each time the lines moves 1 place to the right, it climbs up by 2 places. y = 2x +3 y = mx +c So m = 2 Back to Main Page
8 7 6 y 5 4 3 2 1 1 2 3 4 5 6 7 8 –7 –6 –5 –4 –3 –2 –1 -1 -2 -3 -4 -5 -6 x Finding m and c Find the Value of c This is the point at which the line crosses the y-axis. y = 2x +3 y = mx +c So c = 2 Find the Value of m The gradient means the rate at which the line is climbing. Each time the line moves 1 place to the right, it moves down by 1 place. So m = -1 Back to Main Page
8 7 6 y 5 4 3 2 1 1 2 3 4 5 6 7 8 –7 –6 –5 –4 –3 –2 –1 -1 -2 -3 -4 -5 -6 x Some Lines to Identify Line 1 m = c = Equation: 1 2 y = x + 2 Line 2 m = c = Equation: 1 -1 y = x - 1 Line 3 m = c = Equation: -2 1 y = -2x + 1 Back to Main Page
8 7 6 y 5 4 3 2 1 1 2 3 4 5 6 7 8 –7 –6 –5 –4 –3 –2 –1 -1 -2 -3 -4 -5 -6 x Exercise 5 Click for Answers 1) y = x - 2 3 2) y = -x + 3 3) y = 2x + 2 4) y = -2x - 1 • y = -2x - 1 • 2 2 1 4 Back to Main Page
Further Exercise Sketch the following graphs by using y=mx + c • 1) y = x + 4 • 2) y = x - 2 • 3) y = 2x + 1 • 4) y = 2x – 3 • 5) y = 3x – 2 6) y = 1 – x 7) y = 3 – 2x 8) y = 3x 9) y = x + 2 2 10) y = - x + 1 2 Back to Main Page
The Table Method We can use an equation of a line to plot a graph by substituting values of x into it. Example y = 2x + 1 x = 0 y = 2(0)+1 y = 1 x = 1 y = 2(1)+1 y = 3 x = 2 y = 2(2)+1 y = 5 Now you just have to plot the points on to a graph! Back to Main Page
The Table Method 4 3 1 3 5 2 1 0 -4 -3 -2 -1 1 2 3 4 -1 -2 y = 2x + 1 -3 -4 Back to Main Page
The Table Method Use the table method to plot the following lines: 1) y = x + 3 2) y = 2x – 3 3) y = 2 – x 4) y = 3 – 2x Click to reveal plotted lines Back to Main Page
The Table Method 4 3 2 1 0 -4 -3 -2 -1 1 2 3 4 -1 -2 -3 3 1 Click for further exercises -4 4 2 Back to Main Page
Further Exercise Using the table method, plot the following graphs. • 1) y = x + 2 • 2) y = x – 3 • 3) y = 2x + 4 • 4) y = 2x – 3 • 5) y = 3x + 1 • 6) y = 3x – 2 7) y = 1 – x 8) y = 1 – 2x 9) y = 2 – 3x 10) y = x + 1 2 2 Back to Main Page
The x = 0, y = 0 Method This method is used when x and y are on the same side. Example: x + 2y = 4 To draw a straight line we only need 2 points to join together. Back to Main Page
If we find the 2 points where the graph cuts the axes then we can plot the line. These points are where x = 0 (anywhere along the y axis) and y = 0 (anywhere along the x axis). Back to Main Page
8 7 6 y 5 4 3 2 1 1 2 3 4 5 6 7 8 -6 -5 -4 -3 -2 -1 -1 -2 -3 -4 -5 -6 x This is where the graph cuts the x – axis (y=0) This is where the graph cuts the y – axis (x=0) Back to Main Page
By substituting these values into the equation we can find the other half of the co-ordinates. Back to Main Page
Example Question: Draw the graph of 2x + y = 4 Solution y = 0 2x + 0 = 4 2x = 4 x =2 2nd Co-ordinate= (2,0) x = 0 2(0) + y = 4 y =4 1st Co-ordinate = (0,4) Back to Main Page
8 7 6 y 5 4 3 2 1 1 2 3 4 5 6 7 8 –7 –6 –5 –4 –3 –2 –1 -1 -2 -3 -4 -5 -6 x So the graph will look like this. 2x + y = 4 Back to Main Page
Exercise Plot the following graphs using the x=0, y=0 method. 1) x + y = 5 2) x + 2y = 2 3) 2x + 3y = 6 4) x + 3y = 3 Click to reveal plotted lines Back to Main Page
8 7 6 y 5 4 3 2 1 1 2 3 4 5 6 7 8 –7 –6 –5 –4 –3 –2 –1 -1 -2 -3 -4 -5 -6 x Answers • 3x + 2y = 6 • x + 2y = 2 • 2x + 3y = 6 • x - 3y = 3 Click for further exercises Back to Main Page
Exercise Using the x = 0, y = 0 method plot the following graphs: 1) x + y = 4 2) 2x + y = 2 3) x + 2y = 2 4) x + 3y = 6 5) 2x + 5y = 10 6) x – y = 3 7) 2x – y = 2 8) 2x – 3y = 6 9) x + 2y = 1 10) 2x – y = 3 Back to Main Page
5 4 3 2 1 -5 -4 -3 -2 -1 0 1 2 3 4 5 -1 -2 -3 -4 -5 What are the Co-ordinates of these points? (x,y) Back to Main Page
Negative Numbers Addition and Subtraction (1) 2 + 3 (2) 6 - 5 (3) 3 - 7 (4) -2 + 6 (5) -1 - 2 (6) -4 + 5 (7) -2 - 2 (8) 0 – 4 (9) -3 + 6 (10) -4 - 1 (11) 6 - 8 (12) -5 - 2 (13) -8 + 4 (14) -5 - (- 2) (15) 0 - (- 1) (16) 7 - 12 + 9 (17) -4 - 9 + -2 (18) 14 - (- 2) (19) -45 + 17 (20) 4 - 5½ Back to Main Page
Negative Numbers Multiplication and Division (1) 4 x -3 (2) -7 x -2 (3) -5 x 4 (4) 28 ÷ -7 (5) -21 ÷ -3 (6) -20 ÷ 5 (7) -2 x 3 x 2 (8) -18 ÷ -3 x 2 (9) -2 x -2 x -2 (10) 2.5 x -10 Back to Main Page
Substituting Numbers into Formulae Exercise Substitute x = 4 into the following formulae: • 1) x – 2 • 2) 2x • 3) 3x + 2 • 4) 1 – x • 5) 3 – 2x 2 8 14 -3 -5 6) 4 - 2x 7)x - 3 2 8) 3 - x 2 9) 2x – 6 -4 -1 1 2 Click forward to reveal answers Back to Main Page
Substituting Negative Numbers into Formulae Exercise Substitute x = -1 into the following formulae: 6) 4 - 2x 7)x - 3 2 8) 3 - x 2 9) 2x – 6 6 -3½ 3½ -8 1) x – 2 2) 2x 3) 3x + 2 4) 1 – x 5) 3 – 2x -3 -2 -1 2 5 Click forward to reveal answers Back to Main Page