Modeling Straight Line Graphs: Oil Changes and Engine Repairs
This lesson focuses on modeling real-world data using straight line graphs. It examines the relationship between the number of oil changes per year and the corresponding cost of engine repairs. Students will analyze the provided data table and learn to interpret the graph that emerges from the given information. By the end of the lesson, learners will understand how to use linear models to predict costs and make informed decisions about vehicle maintenance.

Modeling Straight Line Graphs: Oil Changes and Engine Repairs
E N D
Presentation Transcript
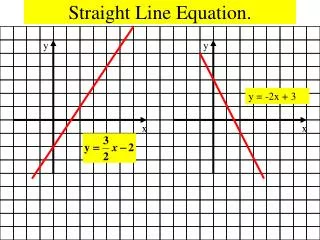
Modelling with Straight Line Graphs Oil Changes and Engine Repairs The table below displays data that relate the number or oil changes per year and the cost of engine repairs. http://illuminations.nctm.org/LessonDetail.aspx?ID=L298
Modelling with Straight Line Graphs Oil Changes and Engine Repairs
Modelling with Straight Line Graphs Oil Changes and Engine Repairs http://illuminations.nctm.org/LessonDetail.aspx?ID=L298
Modelling with Straight Line Graphs Bike Weight and Maximum Height
Modelling with Straight Line Graphs Bike Weight and Maximum Height
Modelling with Straight Line Graphs Weights and Drug Doses
Modelling with Straight Line Graphs Weights and Drug Doses