Download
1 / 53
530 likes | 756 Vues
Cost of Corrosion - Acknowledgement. Amendment to the “Transportation Equity Act for the 21 st Century (TEA-21)” in 1998 led to this project. Cost of Corrosion - Acknowledgement. Project Funded By: Federal Highway Administration (DOT) Office of Infrastructure Research and Development

E N D
Cost of Corrosion - Acknowledgement Amendment to the “Transportation Equity Act for the 21st Century (TEA-21)”in 1998 led to this project
Cost of Corrosion - Acknowledgement • Project Funded By: • Federal Highway Administration (DOT) • Office of Infrastructure Research and Development • Project Manager: Y. Paul Virmani, Ph.D. • In Cooperation With: • NACE International – The Corrosion Society • Disseminating study finding – raise awareness
Cost of Corrosion – Study Contractor • CC Technologies • Gerhardus H. Koch, Ph.D. • Neil G. Thompson, Ph.D. • Michael P.H. Brongers • Joe H. Payer, Ph.D., Case Western – Reserve University
Cost of Corrosion – Presentation Outline • Study Goals • Previous Studies • Current Study • Method 1 – Corrosion Control Methods & Services • Method 2 – Industry Sector Analysis • Highlights of Selected Sectors • Extrapolation to Total Corrosion Cost • Preventative Strategies
Cost of Corrosion – Study Goals • Determines the cost of corrosion control methods and services • Determines the cost of corrosion for specific industry sectors • Extrapolate individual sector costs to a national total corrosion cost • Assess barriers to progress and effective implementation • Develop strategies for realizing cost savings
Cost of Corrosion – Previous Studies • 1950 H.H. Uhlig – US Study: 2.1% of GNP • 1970 T.P. Hoar – UK Study: 3.5% of GNP • 1974 Japan Study: 1.2% of GNP • 1975 Battelle/NBS – U.S. Study: 4.5% of GNP
Cost of Corrosion – Method 1 – Methods & Services • All costs are direct corrosion costs • Disadvantage: many costs are missed • Costs of labor attributed to corrosion management activities • Cost of the equipment required because of corrosion-related activities • Loss of revenue due to disruption in supply of product • Cost of loss of reliability
Cost of Corrosion – Method 2 – Industry Sector Analysis • For each sector, details of analysis are different • Government Reports • Publicly Available Documents • Industry Experts • U.S. Department of Commerce Bureau Census • Existing Industrial Surveys • Trade Organizations • Industry Groups • Individual Companies
Cost of Corrosion – Method 2 – Industry Sector Analysis • 26 Sectors in 5 Categories • Infrastructure • Utilities • Transportation • Production & Manufacturing • Government
Highlights of Selected Sectors Highways & Bridges Transmission Pipelines Drinking Water & Sewer Systems Oil & Gas Exploration & Production
Highways & Bridges $8.3 Billion Per Year
National Bridge Inventory Database • Approximately 600,000 bridges in the U.S • Half were built between 1950and 1994 • The materials of construction • Concrete, steel, timber, masonry, • timber/steel/concrete combinations, & aluminum • This sector focused on reinforced concrete and steel bridges; they make up the vast majority of highway bridges
Highway Bridges – Trends • Reported downward trend in the % structurally deficient bridges - decrease from 18 % to 15 % between 1995 to 1999 • However, costs to replace aging bridges increased by 12 % during the same period. • In addition, there has been a significant increase in the required maintenance of the agingbridges
Sector Summary: Highway Bridges • Replace structurally deficient bridges B$ 3.79 • Maintenance and capital cost • For concrete bridge decks 2.00 • For concrete sub- and superstructures 2.00 • Maintenance painting cost for steel bridges .5 • Total : B$ 8.29
Highway Bridges - Findings • Indirect corrosion costs: • Estimated from life-cycle analysis • Costs to user due to traffic delays & lost productivity • More than ten times the direct cost of corrosion
Gas & LiquidTransmission Pipelines $7 Billion Per Year
Gas & Liquid Transmission Pipelines • Over 480,000 Miles of Gas and Liquid Transmission Pipelines • Gas Transmission • Natural Gas Lines – 328,000 Miles • Liquid Transmission Lines • Crude Oil Lines – 74,000 Miles • Liquid Product Lines – 82,000 Miles • 60% of These Lines Are Over 40 Years
Gas & Liquid Transmission Pipelines • Typical Corrosion Related Costs • Annual ICCP System Investment - $40 Million • Annual Sacrificial CP Investment - $9 Million • Annual O&M Costs - $2.4 Billion - $4.8 Billion • Certification • 30% of Companies has personnel dedicated to Corrosion Control • Regulations require Certification of Corrosion Control Staff • Annual Cost $32.4 Million
Drinking Water &Sewer Systems $36 Billion Per Year
Drinking Water & Sewer Systems • Two Separate Systems • Drinking Water • Sewage Water • Costs in Operation, Maintenance, Finance, Capital Investments • Maintenance crews find and repair leaks, but the number of leaks increases with system age.
Drinking Water & Sewer Systems • System Size • 550 liters of water consumption per person per day • 56.7 Billion m3 / year in the U.S. • 1.4 Million km of municipal water pumping • A major barrier to progress in corrosion management is the absence of complete and up-to-date information on all water systems.
Operation & Management Costs • There are only 2 reasons why utilities replace or change water systems: • Pipes are considered broken, • Leaking water • Corrosion products in the water • Capacity too small for the area • Assume 50% of all operation and maintenance costs are corrosion-related
Three Reports on Water System Costs • 1997 EPA: B$6.9 per year • Drinking water system maintenance only • 1998 AWWA: B$16.3 per year • Drinking water transmission – maintenance only • 2000 WIN: B$51 per year for Drinking Water • B$45 per year for Sewer Systems • Includes Operation, Maintenance, Finance, Capital
Cost of Lost Water • Nationwide, 15% of treated water is lost • Loss of revenue: B$3.0 per year • More than 90% of lost-water cost is corrosion-related, because of leaking systems • Underground leaks go unnoticed: Therefore low cost awareness
Sector Summary: Drinking Water & Sewer Systems • Operation, Maintenance, Finance, Capital • Drinking water systems B$19.25 • Sewer systems B$13.75 • Cost of Lost water B$3.0 • TOTAL B$36.0
Oil & GasExploration Production $1.4 Billion Per Year
Background • Significant available onshore oil & gas reserved have been explored • U.S. 1998 Oil Production – 3.04 Billion Barrels • Recoverable Reserves • Deep Waters Offshore • Remote Arctic Locations • Reservoirs with Unconsolidated Sands
Background • Relative High Costs of Oil & Gas Production in the U.S. • Maintenance Costs Must be Kept to a Minimum • Emphasis on Controlling Internal Corrosion with Corrosion Inhibitors
Sector Summary: Oil & Gas • Operation, Maintenance, Finance, Capital • Surface Piping & Facility Costs M$589 • Downhole Tubing Expenses M$463 • Capital Expenses M$320 • TOTAL B$1.36
How to Extrapolatethe Total Cost of Corrosion
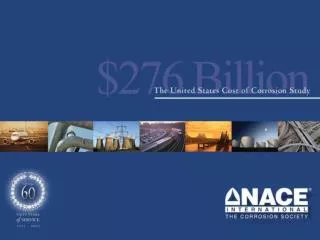
Total Cost of Corrosion • Estimated Cost B$138 • Extrapolated Cost B$276 • Actual Cost >B$550 • Bridges >5 times • Electric Utilities >3 times
Total Direct Cost of Corrosion in the U.S. B$276 / year = 3.1% of GDP 1998 U.S. GDP B$8,790
Non-Technical Preventive Strategies (4) • Increase awareness of the large corrosion costs and potential savings • Change the misconception that nothing can be done about corrosion • Change policies, regulations, standards, and management practices to increase corrosion savings • Improve education and training of staff