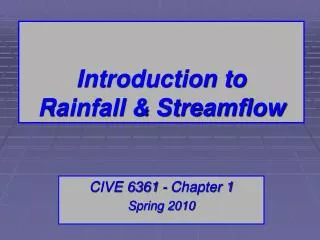
Streamflow Analysis Module 8.7: Frequency Analysis Importance in Water Resource Management
Learn why frequency analysis is crucial for quantifying extreme events, flood flow return periods, engineering design, watershed planning, zoning, and water resource management. Understand the probability of flow availability and how flow variability is quantified through recurrence intervals and flow duration. Explore flood frequency plots and flow duration curves to analyze streamflow variability.

Streamflow Analysis Module 8.7: Frequency Analysis Importance in Water Resource Management
E N D
Presentation Transcript
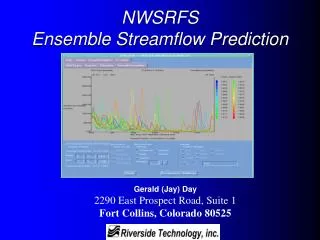
Streamflow Analysis Module 8.7
Frequency Analysis – Why? • Common dialog to describe events • Quantify extreme events • Flood flow return periods • Engineering design • Watershed planning • Zoning • Geomorphic processes • Water resources management • What is the probability of a given flow being available?
How is Flow Variability Quantified? 2 Methods: • Recurrence interval / Flow probability • General technique to describe the probability of an event occurring • Frequently used for flood peaks • Just like we did for precipitation • Flow duration • Indicates the amount of time a given flow is equaled or exceeded • Describes availability of water resources
Frequency Analysis How’s it done? • Rank (sort) events • Calculate return interval (Tr) • Calculate probability (p) Example: Maximum hourly rainfall per year
Frequency Analysis How’s it done? • Rank (sort) events • Calculate return interval (Tr) • Calculate probability (p) • Plot event vs. recurrence interval 1. 2. 3.
Flood Frequency Plot Viessman Fig. 3.9 Source: Viessman & Lewis, Introduction to Hydrology
Flow Duration Analysis Variant of Flow Frequency Analysis • Probability presented as:percent of time a given flow is equaled or exceeded • Often constructed for a complete series of flows • e.g. daily average streamflow
Viessman Fig. 3.14 Flow Duration Curve James River at Cartersville, VA Source: Viessman & Lewis, Introduction to Hydrology
Discharge (cfs) 0 100 Percent of time flow exceededExceedance probability Conceptual Example Which system has greater flow variability?
Siletz River How do disturbance regimes differ?