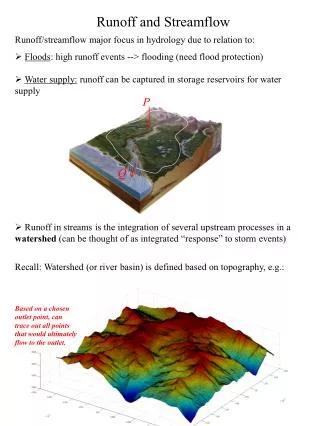
Streamflow and Runoff
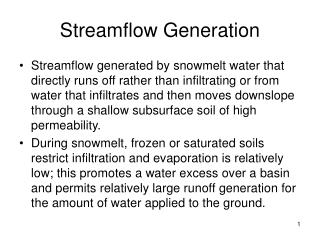
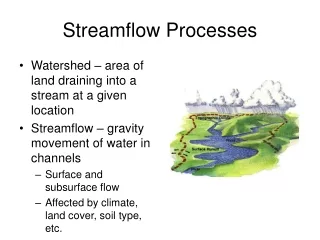
Streamflow and Runoff The character, amount, and timing of discharge from a basin tells a lot about flow paths within the basin Therefore, important to hydrogeologist to identify how to create stream hydrographs from discharge measurements Measurement of discharge :

Streamflow and Runoff
E N D
Presentation Transcript
Streamflow and Runoff The character, amount, and timing of discharge from a basin tells a lot about flow paths within the basin Therefore, important to hydrogeologist to identify how to create stream hydrographs from discharge measurements Measurement of discharge: Method used depends on type of study, size of river and flow, data requirements, etc. For small scale field studies discharge is measured over a cross-section at the point of interest using:
a) float method - time surface float from point a to point b - average velocity is 0.85*surface velocity - mean velocity*x-sectional area = discharge - measurement distance should be ~10x stream width - very rough estimate b) stream gage - average velocity in a stream occurs at 0.368*depth above the bottom - therefore standard to measure along a cross-section at 0.4 depth off bottom - for more accurate estimates, averaging and depth measurements can be made..
c) dye dilution - good method for turbulent streams - need to use tracer that is a) easily soluble, b) have no or very low natural concentrations in stream, c) be conservative, d) easily detectable at low concentrations, e) ecofriendly, f) affordable - sodium chloride (NaCl) often used, and concentration/conductivity relation established - by introducing tracer upstream and measuring rate of concentration change downstream we can calculate discharge for the stream reach for a gulp injection where CT is the initial tracer concentration being introduced Cb is the background concentration in the stream and the integral in the denominator is evaluated graphically from a C vs. t plot..
d) direct measurement - can be used in small streams where it is possible to focus all flow into a collector More “Permanent” installations can be made using: a) - Dam (plate) with a v-notch (typically) that allows for controlled discharge through the notch. - discharge can be related to the height of the back-water - problems with sedimentation
Rectangular Weir Q = 3.33(L-0.2H)H3/2 90o V-notch Where: Q is discharge (cfs) L is length of weir crest (ft) H is head of backwater above crest (ft) See text for metric equations
b) flumes - artificial stream reaches that conduct flow through through a constricted cross section that has a fixed stage-discharge relation (rating curve) - height measured in flume relates directly to discharge - sedimentation problems minimal - -often useful to calibrate with stream gaging over a range of flows (both weirs and flumes). Rating curve
c) stage measurement at natural cross-sections -establish rating curve for natural stream cross-section - use pressure transducer or float in stilling well to continuously measure stage (and therefore discharge) - best sites are: a) more still area just up from fast water reach b) area that is geomorphologically stable
Sonic methods • - • Measure speed of small particles in the flow • Can also track and subtract bottom speed
Slope-Area methods Often in an ungaged area we are interested in assessing the discharge of a recent flood event, or we need discharge where measurements of velocity can’t be made - If evidence of the highest stage is marked on the stream banks can be approximated by measuring two cross-sections (more can be measured) numbered i=1 for the upstream section and i=2 for the downstream section
Dalrymple and Benson Method K is called the conveyance for each cross section g is gravitational acceleration uc is a unit conversion factor ( ) Yi is the average depth for each section Ai is the cross-sectional area for each section Xi is the x-sectional water surface width
C is called Chézy’s C and is a factor describing the cross-section’s resistance to flow Um is another unit-conversion factor n is “Manning’s Roughness Coefficient” (values from tables), generally between 0.0-0.2 ΔZ = diff. Between high water marks of two sections L is distance between two sections k is an eddy coefficient (if downstream x-sect area is bigger than upstream k = 0.5, k=0 is opposite is true This method gives values within 10-20% of reality
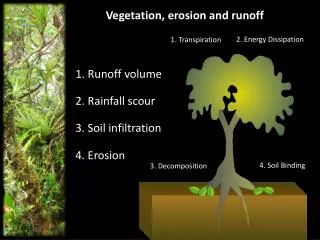
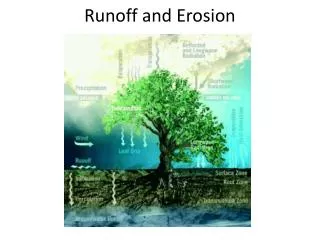
Manning Equation - can be used for past flows or flows under conditions where direct measurements are impossible Where R is the hydraulic radius (ratio of x-sectional area/wetted perimeter)(wetted perimeter is the cross-sectional length of the stream bed), S is the slope of the channel (rise over run, so head gradient). Velocity is in meters/sec Wetted perimeter is a+b+c c a b
Hydrograph - measures either change in stage over time (stage hydrograph) or change in discharge over time (discharge hydrograph) • Ultimately for the hydrograph to be useful we want it in the form of discharge over time. • - hydrographs are an integrated expression of everything influencing surface runoff • - used for: - reservoir design • - assessing influence of flood control structures in reducing flood peaks • - determining duration and frequency of flooding • - separating contributions from ground water and surface water • A hydrograph has four component elements: • 1. • 2. Interflow (soil water moving laterally downslope and entering streams directly) • 3. Groundwater flow (baseflow) • 4. Direct channel precipitation..
Hydrograph can be discharge over any period of time, but usually we analyze hydrographs before during and after specific precipitation events Rising portion of a hydrograph is known as the concentration curve Region in the vicinity of the peak is called the crest segment Falling portion is the The shape of individual hydrographs will depend on the precipitation pattern characteristics and the basin properties Hydrographs can be separated into two major components: quickflow (or event flow, storm runoff, direct runoff) and baseflow..