Download
1 / 21
210 likes | 385 Vues
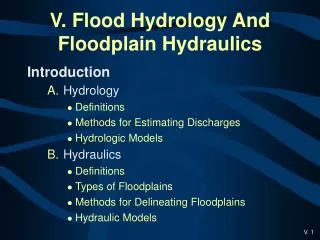
Runoff and Streamflow. Runoff/streamflow major focus in hydrology due to relation to: Floods : high runoff events --> flooding (need flood protection) Water supply: runoff can be captured in storage reservoirs for water supply

E N D
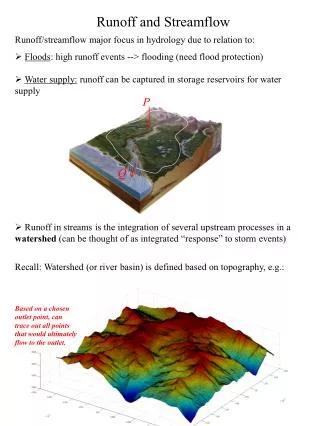
Runoff and Streamflow Runoff/streamflow major focus in hydrology due to relation to: • Floods: high runoff events --> flooding (need flood protection) • Water supply: runoff can be captured in storage reservoirs for water supply • Runoff in streams is the integration of several upstream processes in a watershed (can be thought of as integrated “response” to storm events) Recall: Watershed (or river basin) is defined based on topography, e.g.: P Q Based on a chosen outlet point, can trace out all points that would ultimately flow to the outlet.
Stream Network Similarly, the stream network (within a basin) is defined as those points where flow accumulation area is large, where accumulated flow area (Ac) is the upstream area flowing to a certain point. Together, the watershed consists of a well-defined area with interconnected hillslopes and a channel network. Note: Topographic ridges have low Ac (blue) and main stream channel has high Ac (red/yellow) Map of log(Ac)
Runoff and Streamflow The collection of hillslopes and channels generate runoff from a given pixel and ultimately contribute to streamflow Questions: • What are mechanisms that generate runoff? • When/why/where do they occur? • How do they contribute to the overall flow in stream? Two main classes of runoff: • surface (overland) runoff (two mechanisms) • subsurface runoff (two mechanisms)
Surface (overland) Runoff • Mechanism 1: Infiltration Excess Runoff (“Hortonian” runoff) • Occurs when precipitation rate (P) exceeds infiltration rate (f) of soil • Occurs only during storm; often in localized low conductivity soils (P>K) where ponding at surface occurs hillslope P > f *Saw this when discussing infiltration models
Mechanism 2: Saturation excess overland flow (“Dunne” runoff) • Occurs when groundwater table saturates soil from below (rising water table); precipitation falls on saturated surface • Dynamics of water table leads to expanding/contracting “variable contributing areas” • Runoff occurs only during storm; in lowland areas near streams (i.e. where shallow GW exists) Water table moves up/down in response to storm/inter-storm periods During/after big storm 1 week after storm
Subsurface Runoff • Mechanism 1: Interflow (perched stormflow) • Lateral movement of water through unsaturated zone; often resulting from temporary perched water table on low conductivity soil lens • Generally small component of total runoff; due to unsaturated flow velocities water may reach storm after storm ends • Mechanism 2: Baseflow (GW flow) • Flux of water into streams from unconfined/confined aquifers; baseflow responsible for perennial streams where flow exists during interstorm periods • Recharge and aquifer flow time scales such that flow reaching stream occurs during interstorm period interflow baseflow
Snowmelt Note: Snowmelt is an important contributor to runoff in many regions (including ours). For snow, the melt output acts the same as a precipitation input to the surface. Hence snowmelt can ultimately lead directly to runoff via the following mechanisms: • Infiltration excess runoff (if soil beneath snowpack has low conductivity) • Saturation excess runoff (if soil beneath snowpack is saturated) The subsurface mechanisms may also ultimately contribute snowmelt to streamflow The key point is that runoff generation may occur for long periods in the absence of precipitation when snowmelt is involved.
Hydrographs • Streamflow at basin outlet is often measured; distribution vs. time is called a “hydrograph”, e.g.: How much each mechanism contributes to overall streamflow depends on: • Individual storm (intensity/location/etc.) • basin characteristics (topography, soil types, vegetation types, etc.) For flood forecasting/estimating design flows, generally most interested in “stormflow”= immediate runoff response to storm (baseflow generally does not contribute much to stormflow Goal: Build models for representing runoff processes in basin (i.e., given measured P predict Q). [Note: The subject of hydraulics of flow once water is in channel is one of the main topics of CEE 151.] Note: Time delay between precip. onset and streamflow peak allows for potential prediction
Figure 8.1.3a (p. 249)(a) Separation of sources of streamflow on an idealized hydrograph (from Mosley and McKerchan (1993)).
Basin-scale Rainfall-Runoff Modeling • Modeling approaches: • Empirical/Conceptual Models for Estimating Design Floods/Forecasting: • usually treat basin as lumped unit • use historical data to develop predictive tool • systems (“black-box”) response approach • make simplifying assumptions • computationally efficient • Examples: SCS method, unit hydrograph method, etc. • Physically-based Distributed Hydrologic Modeling: • account for physical processes distributed throughout basin • explicitly model states/fluxes as function of space/time • integrates hydrologic processes via mass/energy balance • require distributed (in space) inputs • computationally demanding Examples: “Topmodel”, “tRIBS”, “Mike SHE”, etc.
Figure 8.2.1 (p. 252)Concept of rainfall excess. The difference between the total rainfall hyetograph on the left and the total rainfall excess hyetograph on the right is the abstraction (infiltration).
Figure 8.2.3 (p. 253)Storm runoff hydrographs. (a) Rainfall-runoff modeling; (b) Steps to define storm runoff.
Note: By construction the response time of the hydrograph (e.g. 42 hours in this case) remains unchanged for a D-hr event
Note: As more complex responses are “built-up” from multiple UHs, the response time may change (e.g. in this case 48 hours for a 2*D-hr storm)
Effective Rainfall Being able to apply the UH method requires a mechanism for estimating the effective rainfall (Peff). This can be done using a physical model (i.e. attempting to predict the infiltration/runoff partitioning). Alternatively, it is often done empirically. One example is using the Soil Conservation Service (SCS) method: where Peff in this equation is given in units of inches (as is the measured rainfall P) and Vmax is the watershed storage capacity (also in inches) which is estimated via: where CN is the so-called SCS curve number and can be determined from tabulated values for different soil or land-use types. The single curve number for a basin is often determined from a weighted average of the curve numbers for different soil/land-use types in the basin based on their relative areas. Note: This type of method is highly empirical and will generally introduce some error in the estimate of effective rainfall.
Figure 8.6.1 (p. 262)Variables in the SCS method of rainfall abstractions; Ia = initial abstraction, Pe = rainfall excess, Fa = continuing abstraction, and P = total rainfall.
Figure 8.6.2 (p. 263)Solution of the SCS runoff equations (from U.S. Department of Agriculture Soil Conservation Service (1972)).