Download
1 / 25
270 likes | 297 Vues
Gain insights on aquifer properties & movements in coastal settings using advanced modeling techniques beyond classical methods. Case study on Cape Cod aquifer system's geology and flow dynamics. Explore results from various pumping test analyses.

E N D
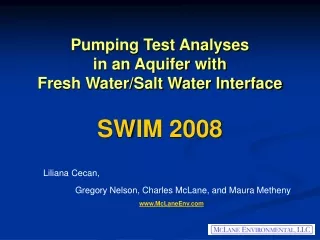
Pumping Test Analyses in an Aquifer with Fresh Water/Salt Water Interface SWIM 2008 Liliana Cecan, Gregory Nelson, Charles McLane, and Maura Metheny www.McLaneEnv.com
Introduction • Pumping tests – drawdown data, are often used to gain information regarding the aquifer properties, such as hydraulic conductivity and storativity • Pumping test analysis in coastal aquifers with a fresh water/salt water interface should be evaluated to account for movements of both: • Water Table, and • Salt Water Interface • In order to determine accurate estimates of hydraulic conductivity and vertical anisotropy distributions in coastal settings, pumping test analyses should extend beyond classical methods to groundwater flow and transport modeling • The flow and transport modeling should account for variable density flow • Case study: Cape Cod, Massachusetts
Cape Cod Site Geology • Glacial sediments deposited in a lacustrine deltaic system 15,000 years ago (Oldale 1992) • Glacial sediments extend 900 ft below ground surface to crystalline bedrock (Masterson 2004) • Aquifer system is composed of several fresh water lenses – the site lies in the Pamet Lens (Walter and Whealan 2004) • Average recharge is 24 in/yr (Masterson 2004) • Groundwater flow is radial toward the Atlantic Ocean (East), Cape Cod Bay (West), Pilgrim Lake (North), and Herring River (south) References Oldale RN (1992) Cape Cod and the Islands, the Geologic Story. Parnassus Imprints, East Orleans, Massachusetts Masterson, J.P., 2004, Simulated interaction between freshwater and saltwater and effects of ground-water pumping and sea level change, Lower Cape Cod aquifer system, Massachusetts: USGS. S.I.R. 2004-5014, 72 p. Walter, D.A., and Whealan, A.T., 2004, Simulated water sources and effects of pumping to wells and surface waters, Sagamore and Monomoy flow lenses, Cape Cod, Massachusetts: USGS S.I.R. 2004-5181, 85 p.
Cross-SectionA-A’ Pumping Test Well Network
Cross-SectionA-A’ Cross-SectionB-B’ Pumping Test Well Network
Cross-Section C-C’ Cross-SectionA-A’ Cross-SectionB-B’ Pumping Test Well Network
Cross-Section C-C’ TPW-1 OW-8 TPW-2 Cross-SectionA-A’ Cross-SectionB-B’ Pumping Test Well Network
TPW-1 TPW-2 10-Day Pumping Test
Cluster Wells Cluster Wells Cluster Wells Cluster Wells
Pumping Test AnalysesClassical Methods - Well Clusters Cluster Well Analysis: Kh ~ 280 ft/day Kh/Kv ~ 2:1
Pumping Test AnalysesClassical Methods – Group Analysis GROUP 1 GROUP 3 GROUP 2
Kh ~ 300 ft/day Kh/Kv ~ 10:1 GROUP 1 Pumping Test AnalysesClassical Methods – GROUP 1
Kh ~ 300 ft/day Kh/Kv ~ 10:1 GROUP 2 Pumping Test AnalysesClassical Methods – GROUP 2
Kh ~ 350 ft/day Kh/Kv ~ 15:1 GROUP 3 Pumping Test AnalysesClassical Methods – GROUP 3
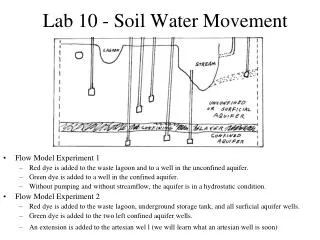
Steady State Transient Pumping Test AnalysesMODFLOW – Box Model MODFLOW Kh ~ 100 ft/day Kh/Kv = 10:1 to 30:1
Test Wells A B’ Test Wells -60’ Test Wells A B’ -150’ Fresh Water -225’ -275’ Salt Water Variable Density Modeling
Simulated after 100 years of pumping Simulated after 10 days of pumping Measured after 10 days of pumping Initial Concentration Measured before pumping Variable Density Modeling s SEAWAT Kh = 200 ft/day (shallow) to 10 ft/day (deep) Kh/Kv = 30:1 (shallow) to 1,000:1 (deep)
Variable Density Modeling Test Well Salt Water Simulated after 100 years of pumping
Conclusions Modeling • Classical analytical methodsKh = 150 to 300 ft/day & Kh/Kv = 2:1 to 10:1 • MODFLOW - box model that accounted for recharge and heterogeneity, Kh ~ 100 ft/day & Kh/Kv = 10:1 to 30:1 • SEAWAT - variable density model lower Kh (200 ft/day - shallow to 10 ft/day - deep), and higher Kh/Kv (30:1 - shallow to 1,000:1 deep)
Conclusions Field Measurements • Cluster wells with multiple screens, mostly in the transition zone • Adequate and robust horizontal distribution of the well clusters • Pump test duration at least 10 days, or longer, to intercept changes in salt water interface
Conclusions General • Pump tests in coastal aquifers are of paramount importance in estimating accurate safe yield pumping rates (also see the paper “Evaluating Safe Yield for Supply Wells in an Aquifer with Fresh Water / Salt Water Interface” presented by Gregory Nelson)
Thank you! • Acknowledgments The authors wish to thank Mark White of Environmental Partners Group and Andrew Miller of Head First for many hours of discussions that have helped to improve this paper. We’d also like to thank John Masterson of the U.S. Geologic Survey for discussions on the U.S.G.S. Cape Cod SEAWAT model. • For additional information please visit our web page at http://www.mclaneenv.com/sub_links/news.htm