BP Routing Collaboration Tool
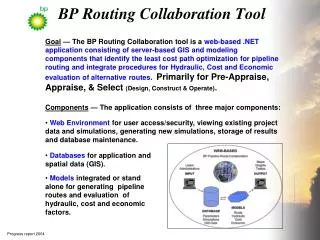
BP Routing Collaboration Tool. Components — The application consists of three major components: Web Environment for user access/security, viewing existing project data and simulations, generating new simulations, storage of results and database maintenance.

BP Routing Collaboration Tool
E N D
Presentation Transcript
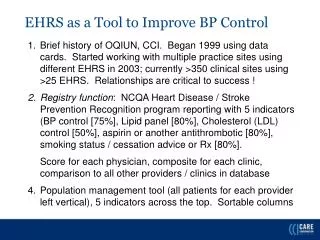
BP Routing Collaboration Tool • Components — The application consists of three major components: • Web Environment for user access/security, viewing existing project data and simulations, generating new simulations, storage of results and database maintenance. • Databases for application and spatial data (GIS). • Models integrated or stand alone for generating pipeline routes and evaluation of hydraulic, cost and economic factors. Goal — The BP Routing Collaboration tool is a web-based .NET application consisting of server-based GIS and modeling components that identify the least cost path optimization for pipeline routing and integrate procedures for Hydraulic, Cost and Economic evaluation of alternative routes. Primarily for Pre-Appraise, Appraise, & Select (Design, Construct & Operate). Progress report 2004
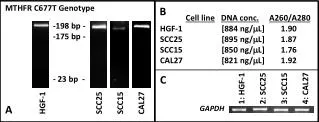
Application Process Flow Segment: Terrain factor Climate Land Use Slope Reinstatement Groundwater Environment Crossings Geo-hazards Web-based Factor Maps Normal User User Admin Project Admin Model Admin Data Admin User Input User Input Cost Model Economic Model Route/Corridor Routing Model Hydraulic Model Database Interface/Security R, H, C, E Models Model Parameters Map Data _________________________ Simulations Segment: Elevation Slope length Terrain factor GIS-derived Input Data User Input
Database Elements Global Map Level Regional Map Level • Administrative Data (Oracle) • Tabular data specifying user profiles, security setting, etc. • Non-Spatial Model Data (Oracle) • Tabular Input and Tabular/Graphic Output data • for the Hydraulic, Cost and Economic Models • Spatial Data (Arc SDE) • Background/Navigational maps for reference (vector) • Routing Model maps of selection criteria (raster) • Global Maps (1km)— 8 layers including • exclusion and preference layers (online) • Regional Maps (30-90m)— 22 layers including • exclusion and preference Layers (project specific) • Local Maps (<30m)— custom set of additional • high resolution map layers as appropriate for final • siting and engineering design • GIS-derived data for input to the Hydraulic and Cost Models
BP Routing Model Criteria Maps (Regional) Exclusions Physical Barriers Maximum Slopes Security Conflicts Protected Areas City Centers Unstable Areas Can’t go there… Combined EXCLUSIONS Environmental Land Cover (1) Sensitive Areas (7) (1) Avoid if possible… Discrete Cost Surface Wt. Average Environmental Construction Land Use (1) Ground Type (6) Infrastructure (3) Major Crossings (5) Terrain Slope (8) Construction Period (7) Restoration Costs (3) Wt. Average ALL CRITERIA (1) Wt. Average Construction Hazards Regional Security (8) Geo-hazards (9) Third party (5) Construction Hazards (1) (1) Wt. Average Hazards Consequences Population Density (9) Population Proximity (4) Environmental HCA (9) HCA Proximity (1) (1) Wt. Average Consequences Step 1 generating the Discrete Cost Surface is the most critical step Routing Model Excluded Areas Routing Criteria: Environmental Factors Construction Concerns Hazards to Avoid Consequences Overall Avoidance
Project Selection(BP-Pipe) Upon logging-in, users are presented with a listing of existing projects they are authorized to view. Selecting a project enables them to interact with existing project simulations they or others have created, or generate new project simulations to identify new alternative routes or to specify different evaluation model assumptions.
Setting-up a Route Simulation (Project Area) Using the Global database, the user selects a new Project Area, identifies beginning/end points… …and criteria layers and weights to be used (only terrain slope in this example) Discrete Cost Surface Fort Collins Discrete Cost Surface(slope) San Diego
Setting-up a Route Simulation(user input interface) 1) Enter route simulation name and comments 2) Identify criteria layers and weights to be used for the simulation 3) Identify Begin and End points that will define the route …the simulation parameters are written to a queue to be processed as hardware and software resources come available (about 3 to 5 minutes for a “typical” routing simulation)
Route Simulation Results The simulation is queued for processing then displayed as the Optimal Route (blue line) and 1% Optimal Corridor (cross-hatched) FC Fort Collins 4% Corridor SD 1% Corridor Optimal Path San Diego
Route Segmentation(Hydraulic Model Input) Hydraulic Model Input Elevation profile Segment slope Soil/Slope Terrain factor Uniform Length Segmentation S20 S18 S16 S14 S12 S19 S8 S10 S6 S17 S13 S15 S11 S4 S2 S7 S9 S5 S3 S1 # Segments Length Terrain-based Segmentation …based on planimetric distance such that segments are all the same length Elevation Hydraulic Input Table S16 S15 S14 S11 S13 S9 S6 S7 S12 S10 S8 S3 S1 S5 S4 S2 …based on elevation profile such that segments are dependent on terrain inflection points Natural gas tool recommends optimal combination of pipe diameter, MAOP, & compressor station size/spacing to deliver the most cost effective solution. Liquid tool calculates optimum combinations of pipe diameter, design pressure, pumping requirements, & pressure reduction stations to find the solution for minimum cost.
Hydraulic Model(Excel) Routing Variables Input Input Specifications Output
Route Segmentation(Cost Model Input) Cost Input Table Cost Model Input Design Factor, Land Use, Ground Water, Geo-hazards, etc. B B Conditions-based Segmentation Design Factor Land Use Ground Water Geo-hazards Climate A A A A A Universal Conditions A B A & B S11 S7 S9 S4 S8 S10 Variable Length Segments S6 S5 S1 S3 S2 …intersecting the route with the “universal conditions” map divides the route into segments having constant conditions throughout their lengths. Tool estimates material, construction, & overhead costs for onshore pipelines & associated facilities The basis of the tool is a calculation algorithm which uses cost factors (or cost increments) based upon the inputs Factored cost elements are then re-compiled into an overall cost estimate – which reflects the combined impact of the input pipeline characteristics
Cost Model(Excel) Pipeline Name & Length Input General Size & Location Data Line Pipe Material & Costing Data Output Product Characteristics & Wall Thickness Data
Economic Model(Excel) The Economic Model is used to calculate project economic parameters to assess the commercial viability of the project. Output parameters include NPV, IRR, & Tariff.
Application Processing Flow (Summary) Generate Route Evaluate Route Processing Flow (1) User Environment– login and select project (User, Projects, Data and Model Administer access) (2) Project Simulations– view previous results and enter specification for new simulations (3) Databases– application automatically accesses appropriate parameters and spatial data (4) Routing Criteria– map layers at the appropriate analysis level are weighted (5) Routing Model– routing model derives the optimal route and corridor (6) Route Segmentation– proposed route is divided into segments for calculating Hydraulic and Cost model input parameters (7) Hydraulic Model– route is segmented, GIS data derived, user input specified then results generated (8) Cost Model– route is segmented, GIS data derived, Hydraulic Model results and user input specified input then results generated (9) Economic Model– Cost Model results and user input specified then results generated Generate Route Evaluate Route
Similarities and Differences Electric Transmission Line Oil & Gas Pipeline Both the GTC and the BP applications utilize well established Routing and Optimal Path techniques to determine the best route for a linear feature… …the GTC application is unique in how it directly involves stakeholders in the calibration and weighting map criteria layers and establishes a procedure that is objective, quantitative, predictable, consistent, and defensible(social emphasis) …the BP application is unique in how it directly involves stakeholders in the simulation of potential routes within a web environment and the full integration of GIS and Excel decision support models (technological emphasis) …so what is the take-home for GIS students and professionals?