Download
1 / 21
210 likes | 365 Vues
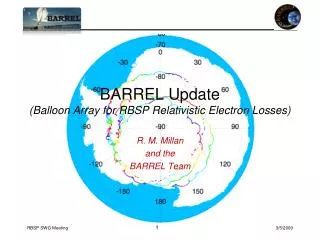
Balloon Array for RBSP Relativistic Electron Losses. BARREL TEAM. Dartmouth College Robyn Millan Mary Hudson David McGaw Leslie Woodger * Jessica Hewitt Karl Yando Brett Anderson Nick Knezek Julianna Scheiman Mike D ’ Andrea * Now at USAF Academy. University of Washington

E N D
BARREL TEAM • Dartmouth College • Robyn Millan • Mary Hudson • David McGaw • Leslie Woodger • *Jessica Hewitt • Karl Yando • Brett Anderson • Nick Knezek • Julianna Scheiman • Mike D’Andrea • * Now at USAF Academy • University of Washington • Michael McCarthy • Amanda Baker • U. C. Berkeley • John Sample • Bob Lin • U. C. Santa Cruz • David Smith • Max Comess • Andrew Liang • Warren Rexroad
Electron Losses • Decreases of the trapped electron flux can be rapid and catastrophic Depletions in >2 MeV electron flux measured by GOES spacecraft (Onsager et. al, 2002) Superposed epoch study of 52 depletion events => real losses of electrons (Green et al., 2004) Electrons still gone ...even after magnetic field returns to dipolar
Precipitation Losses • Precipitation into the atmosphere plays an important role. Increase in SAMPEX bounce loss cone flux => precipitation (Green et al., 2004) • Electrons scattered to small pitch angles (for example by plasma waves) and collide with the atmosphere: Bm = Beq/sin2αeq • Difficult to measure with equatorial spacecraft since equatorial loss cone is very small and difficult to resolve.
BARREL Project Overview • BARREL is a multiple-balloon experiment designed to study relativistic electron precipitation • Two Antarctic Science Campaigns during RBSP Mission • 20 small balloon payloads in each campaign in 2013 and 2014 • Launched successively to set up slowly drifting array • Long duration balloon flights => 30 day campaign • >3000 hours of data in radiation belt region (L<7) • Launch sites planned: Halley Bay and South African Antarctic station (SANAE)
Science Objectives • Determine electron loss rate during specific relativistic electron events • Simultaneously measure precipitation over a wide range of magnetic local times. • Directly test models of wave-particle interactions • Combine balloon measurements of precipitation with in situ RBSP measurements of plasma waves and particles • Determine relative importance of different classes of precipitation • Occurrence probability maps in L-value and MLT • Determine spatial extent and large-scale structure of precipitation. • Multi-point measurements provide large-scale coverage and resolve spatial-temporal ambiguity.
Balloon Observations of Loss • Bremsstrahlung X-rays are produced as electrons collide with atmospheric neutrals. ~70 km Balloon observations of MeV X-rays made in 1996 over Kiruna, Sweden ~30 km • The nearly-stationary balloon platform is complimentary to spacecraft observations
Payload Design • Supporting Instrumentation • GPS time and position: Trimble Lassen SQ • Data Acquisition System • Telemetry: Iridium satellite network ~2kbps • Payload • Suspended mass: 25 kg (payload ~20 kg) • Power: ~6W supplied by solar power system • Hand launched on 300,000 cu ft. balloon to float altitude ~36 km
Platform - Balloon Array • BARREL uses an array of balloons to achieve its science • - 4-5 balloons aloft simultaneously • - separation 1-2 hours of MLT • - flight durations ~7 days • - 20 balloons per campaign • Two launch sites: • Halley Bay • SANAE
Platform - Balloon Array • BARREL uses an array of balloons to achieve its science • - 4-5 balloons aloft simultaneously • - separation 1-2 hours of MLT • - flight durations ~7 days • - 20 balloons per campaign • Two launch sites: • Halley Bay • SANAE
Flux Depletion Events • Precipitation observed by POES during GOES dropout event • Precipitation maps to distances inside geosynchronous satellites • GOES sampling open drift paths for at least part of the time (Millan et al., 2010)
BARREL with Other Resources • Strengths of balloon-based measurements: • know definitively that what we’re seeing is precipitating electrons • can separate temporal and spatial variations • array provides multi-point measurements • How can we best combine our data with other observations? • - unique opportunity to measure precipitation, particle distributions, and waves simultaneously • - compare precipitation rate with trapped flux • - map the location of precipitation to the equatorial plane • - comparison with riometer data - cross calibration of two methods • - combine with ground based measurements of ULF and EMIC waves • - quantitatively test wave-particle interaction theories
BARREL Project Status • Series of test flights conducted in 2008, 2009, 2010 • Successful Confirmation Review in March 2010 • I&T of first science payload in late July 2011
Information BARREL Provides • Available near real-time (within 1 hour)Balloon locations – where are measurements available? • Times of conjunctions with RBSP.Quick-look plots (e.g. count rates, raw spectra)Is there energetic precipitation at a given location and time? • Data publicly available: Ascii, CDF, IDL save files – uncalibrated data extracted from binary filesFast Spectra: X-ray count rate in 4 energy channels at 50ms Higher resolution 48 channel X-ray spectra every 4 sec.Highest resolution 256 channel X-ray spectra accumulated over 32 s (for calibration)Requiring more processing (bkgnd subtraction; modeling response, etc.)Flux and energy spectrum of precipitating electrons for specific events.Spatial distribution of precipitation (maps)IDL software tools For plotting data and balloon locationsSpectral analysis and inversion of X-ray spectrum, instrument response

![Theory of relativistic runaway electron avalanche (RREA) [3]](https://cdn2.slideserve.com/4706985/slide1-dt.jpg)