Fine-Scale Radar Observations of Boundary Layer Structures in Landfalling Hurricanes
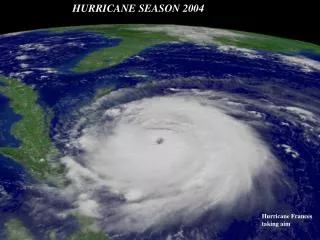
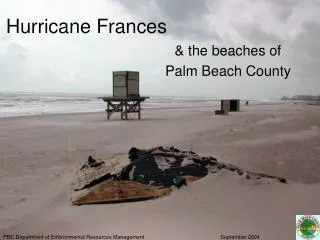
This study presents detailed radar observations of boundary layer structures during landfalling hurricanes, focusing on Hurricanes Ike, Rita, Frances, and Ivan, among others. Utilizing Doppler On Wheels (DOW) radars, the research investigates the intensity of boundary layer streaks, mesovortices, and surface windfields as the hurricanes approach land. High-resolution dual-Doppler analyses reveal complex interactions between different scales of boundary layer features and their impacts on local wind patterns. The results enhance our understanding of hurricane dynamics and boundary layer processes critical for improving forecasting accuracy.

Fine-Scale Radar Observations of Boundary Layer Structures in Landfalling Hurricanes
E N D
Presentation Transcript
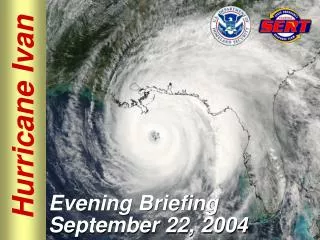
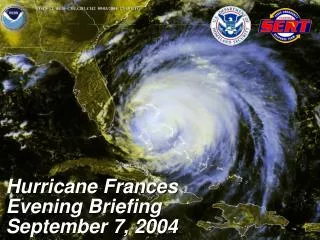
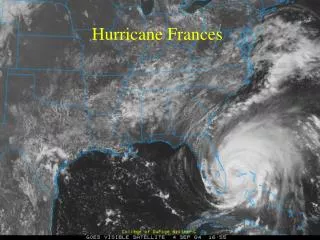
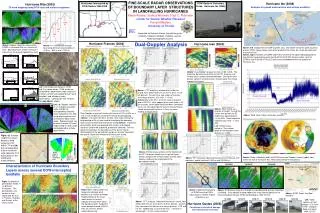
FINE-SCALE RADAR OBSERVATIONS OF BOUNDARY LAYER STRUCTURES IN LANDFALLING HURRICANES Karen Kosiba, Joshua Wurman, Paul Robinson Center for Severe Weather Research Forrest Masters University of Florida Supported by National Science Foundation grants 0734001, 0910737, 0328421, 0329522, and the National Geographic Society FINE-SCALE RADAR OBSERVATIONS OF BOUNDARY LAYER STRUCTURES IN LANDFALLING HURRICANES Karen Kosiba, Joshua Wurman, Paul C. Robinson Center for Severe Weather Research Forrest Masters University of Florida Hurricane Ike (2008) Hurricane Rita (2005) Hurricanes Intercepted by DOW Radars 1996-2008 DOW Radar in Galveston, Texas. Hurricane Ike (2008) Analysis of eyewall mesovortices and surface windfield 2D wind mapping using DOW data and surface roughness Texas City Hutchinson Island ~1200 m 10 km 5 km ~800 m Fort Pierce, Florida ~525 m Supported by National Science Foundation grants 0734001, 0910737, 0328421, 0329522, and the National Geographic Society 5 km Positions of DOW2, DOW3, and the dual-Doppler domain. Dual-Doppler Analysis Above: Doppler velocities observed by DOW3 in hurricane Rita as a function of time. Boundary layer streaks increase in intensity as the eyewall approaches land. Hurricane Frances (2004) Galveston Above: FFT wavelength analysis illustrating dominant wavelengths of ~525 m, ~800 m and ~1200 m. Hurricane Ivan (2004) Above, left: Deployment of DOW 6 (green star), two mobile mesonets (pink squares) and ten PODs (aqua circles) during the landfall of Hurricane Ike. Arrow denotes path of center of eye. Above, right: Positions of DOW6 and PODs relative to the observed propagation of two distinct mesovortices occurring 06:02:37-06:18:02Z (brown circles, north of DOW 6) and 06:35:29-07:06:22Z (red circles) embedded within the eyewall of Hurricane Ike. 14:53:49 14:53:57 14:54:04 FFT cross-section 1 km ~ 9s Above: Dual-Doppler analysis of Ivan at 160 m AGL The black line denotes the location of the FFT analyses and vertical cross-sections presented below. During this time period, coherent structures were mostly larger than those present in Frances. Left: Intercomparison between DOW and 10 m tower winds. DOW winds are corrected for observation angle, exposure of towers (which varies depending on wind direction), and altitude of radar observations. Comparison with T0 tower (on map above) shown. • Above: FFT analyses, windward of the barrier island, from 2300-0200 UTC on the 12.5 km x 12.5 km domain. At each time, two scales of features are always present: 0.8 and 1.1-1.3 km. Additionally, at 00 UTC, a 0.6 km scale is present and at 02 UTC, there appear to be small-scale < 0.6 km features, which potentially have been smoothed out or are unresolved by the current wind synthesis. Larger wavelength features (> 2km) are more evident at earlier times. Left: (a) Doppler velocities at a 1.2-degree elevation angle and (b) the corresponding velocities when reduced to 10m AGL using open exposure and corrected for observation angle. Reduced winds can be used to create 2D wind maps based on land usage and compared to surface observations. a b Above: Mean winds as a function of height. During this 1-hour time period, the BL height was approximately 1.4 km AGL. Peak tangential velocities occurred ~ 1.2 km AGL. • Dual Doppler analysis of Hurricane Frances at 100 m AGL on a 12.5 x 12.5 km domain using 40 m horizontal grid spacing (Above). A smaller (5.5 km x 5.5 km), finer-scale (horizontal grid spacing of 20 m) was used to investigate the boundary layer structure leeward of the barrier island (Below). Horizontal perturbation winds are depicted with vectors and colored contours (yellow/red outbound, green/blue inbound). The thin, black lines denotes the boundaries of the barrier island. Wavelengths of the perturbation winds are smaller leeward of the barrier islandthan windward of the barrier island. Above: Wind trace at East Galveston seawall Left: Vertical cross-sections. The vertical depth of the boundary layer features is ~0.5km Right: (a) Surface roughness values based on land usage for Port Arthur, TX and (b) the corresponding 3-hour maximum wind speed at 10 m AGL based on the DOW wind measurements. Winds lower in built up residential area Winds higher in open area a b • Above: Vertical cross-sections at the locations of the FFT analyses (black lines in top left figure). Vectors indicate the vertical motion and the color contours indicate the magnitude of the perturbation winds. Above: Radar reflectivity (left) and DOW-measured Doppler velocity (right) from within the eye of Hurricane Ike. Red circles denote mesovortices. Above: FFT analyses indicating the presence of features with dominant spatial scales of 1400 m and 700-800 m. Characteristics of Hurricane Boundary Layers across several DOW-intercepted landfalls Some Pods Co-located with FCMP towers 10 km 5 km Right: Examples of perturbation winds in six different hurricanes. The perturbations are weaker in Ivan, Isabel and Ike than in Frances, Georges and Gustav at the times shown. Right: Mean radial (solid) and tangential (dashed) wind profiles as a function of height. Height profiles of the mean radial winds in Frances indicate that data were within the boundary layer. Tangential winds peaked around 4-500 m AGL for all times, before slowly decreasing. Above: DOW scans every 8 s through an individual wind gust as it destroys a building. Data indicate leading edge of the most intense portion of the wind-streak/gust impacts DOW and building at 1454:13 UTC. Above: DOW, Tower, and Pod positions Left: Video captures of roof collapse ~5 m from DOW. Collapse begins at about 1454:13 UTC • Above: FFT analyses, leeward of the barrier island, from 2300-0200 UTC on the 5.5 km x 5.5 km domain. At each time, two scales of features are always present: 0.75 and 0.5 km. Additionally, at 23 and 02 UTC, a feature of wavelength < 0.4 km scale is present. Hurricane Gustav (2008) Correlation of structural damage with individual wind streaks Above: Deployment locations of DOW6 and five PODs (aqua circles) relative to path of Gustav’s eye. 14:48:53 14:54:13 14:54:17 14:54:18 14:54:19 14:54:20