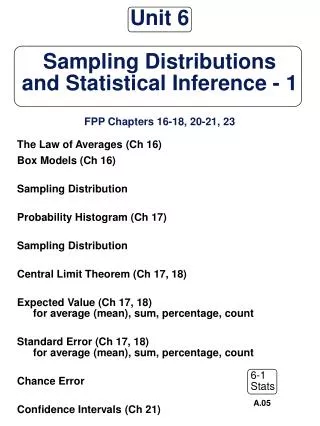
Exploring the Central Limit Theorem through Dice Simulation
This interactive simulation demonstrates the Central Limit Theorem (CLT) using dice rolls. By rolling a single die, two, three, five, and even twenty dice, we analyze how the sampling distribution of the mean approaches normality as sample size increases. The simulation records 10,000 rolls for each scenario, allowing us to observe trends. Key insights include the independence of observations and random sampling, which are critical for satisfying CLT assumptions. Understanding these concepts provides a deeper appreciation of statistical modeling and the behavior of sample distributions in different contexts.

Exploring the Central Limit Theorem through Dice Simulation
E N D
Presentation Transcript
Dice simulator • http://www.stat.sc.edu/~west/javahtml/CLT.html • Let’s roll a single die a few times and see what happens • What do you think would happen if we rolled 2 dice? • Would we expect the same distribution? • Now let’s try 3 dice and then 5 dice
NFL Data Minitab data set
Sampling Distribution of a Mean Rolling dice simulation 10,000 individual rolls recorded Figure from DeVeaux, Intro to Stats
Sampling Distribution of a Mean Roll 2 dice 10,000 times, average the 2 dice Figure from DeVeaux, Intro to Stats
Sampling Distribution of a Mean Rolling 3 dice 10,000 times and averaging the 3 dice Figure from DeVeaux, Intro to Stats
Sampling Distribution of a Mean Rolling 5 dice 10,000 times and averaging Figure from DeVeaux, Intro to Stats
Sampling Distribution of a Mean Rolling 20 dice 10,000 times and averaging Once again, as sample size increases, Normal model appears Figure from DeVeaux, Intro to Stats
Central Limit Theorem • The sampling distribution of any mean becomes more nearly Normal as the sample size grows. • The larger the sample, the better the approximation will be • Doesn’t matter what the shape of the distribution of the population is! (uniform, symmetric, skewed…) • Observations need to be independent and collected with randomization.
CLT Assumptions • Assumptions: • Independence: sampled values must be independent • Sample Size: sample size must be large enough • Conditions: • Randomization • 10% Condition • Large enough sample
Which Normal Model to use? The Normal Model depends on a mean and sd Sampling Distribution Model for a Mean When a random sample is drawn from any population with mean µ and standard deviation σ, its sample mean y has a sampling distribution with: Mean: µ Standard Deviation:
Example: CEO compensation 800 CEO’s Mean (in thousands) = 10,307.31 SD (in thousands) = 17,964.62 Samples of size 50 were drawn with: Mean = 10,343.93 SD = 2,483.84 Samples of size 100 were drawn with: Mean = 10,329.94 SD = 1,779.18 According to CLT, what should theoretical mean and sd be? Example from DeVeaux, Intro to Stats
Normal Models Binomial µ = npσ = Sampling distribution for proportions Sampling distribution for means SD(y) =