Download
1 / 7
70 likes | 171 Vues
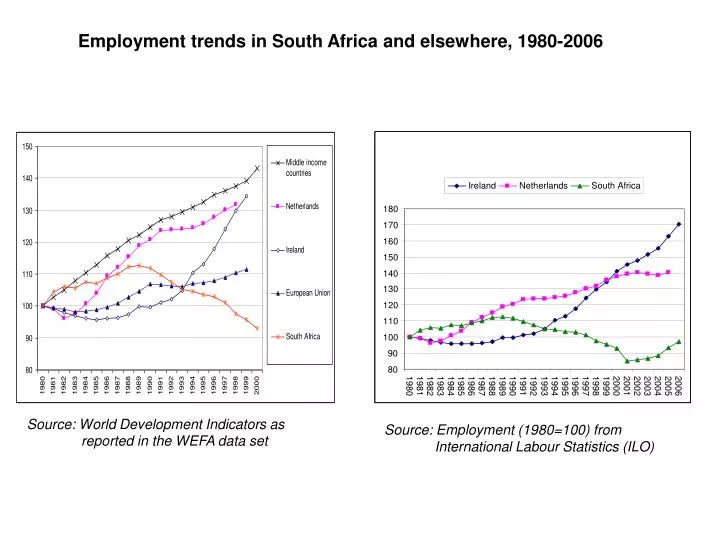
Ireland. Netherlands. South Africa. 180. 170. 160. 150. 140. 130. 120. 110. 100. 90. 80. 1980. 1981. 1982. 1983. 1984. 1985. 1986. 1987. 1988. 1989. 1990. 1991. 1992. 1993. 1994. 1995. 1996. 1997. 1998. 1999. 2000. 2001. 2002. 2003. 2004. 2005. 2006.

E N D
Ireland Netherlands South Africa 180 170 160 150 140 130 120 110 100 90 80 1980 1981 1982 1983 1984 1985 1986 1987 1988 1989 1990 1991 1992 1993 1994 1995 1996 1997 1998 1999 2000 2001 2002 2003 2004 2005 2006 Employment trends in South Africa and elsewhere, 1980-2006 Source: World Development Indicators as reported in the WEFA data set Source: Employment (1980=100) from International Labour Statistics (ILO)
Production and Employment Trends in SA Footwear Industry Year Local Production Imports Employment 2006 20.35% 79.65% 10 100 2005 16.95% 83.05% 1995 47.91% 52.09% 23 600 (1997) 1985 78% 22% Source: South African Footwear and Leather Industries Association
Total TEA 2006 index (Total Earlystage Entrepreneurial Activity) Highlights and Italics = countries within the upper middle income group
Annexure 1 Quoted from Global Entrepreneurship Monitor 2006 “The primary measure of entrepreneurship that GEM uses is the Total Earlystage Entrepreneurial Activity (TEA) index. The TEA index measures the percentage of individuals between the ages of 18 and 64 that are involved in starting a new business. Individuals may start the business on their own account. They may also start the business in collaboration with or on behalf of an existing business. They do need to own the business, either partly or wholly, and to manage it, either on their own or with others. The creation of a new business is a process, which GEM sees as a two phase process. The first phase is the startup phase, a three month period during which (one or more) individuals identify the products or services that the business will trade in, access resources (such as finance) and put in place the necessary infrastructure, which would include staff. When the business is in this phase of development, it is referred to as a startup firm. The next phase, a period of 3–42 months, is when this new business begins to trade and compete with other firms in the market place. When the business is in this phase of development, it is referred to as a new firm. The definition of a new firm is a business that has paid salaries or wages for longer than three months. Once a business has established itself and is more than 42 months old, it is referred to as an established firm. The TEA index, the primary measure used to compare the rate of entrepreneurship both amongst countries as well as annual variations within a specific country, measures how many new businesses are started in a given year. The key question in the survey that is used to establish the TEA rate is, ‘Are you, alone or with others, expecting to start a new business, including any type of self-employment, within the next three years?’ The TEA rate therefore includes startup businesses and new firms, but does not include established firms. In other words, it measures early stage entrepreneurial activity only. The TEA rate captures individual entrepreneurship, but does not capture another equally important source – the launch of a new business venture by the owner manager of an established firm. This prompted the need to redefine TEA as ‘Total Earlystage Activity’, rather than Total Entrepreneurial Activity. Therefore, whenever TEA appears in this report, it refers to ‘Total Earlystage Entrepreneurial Activity’.”