Exploring Microbial Communities in Wetlands vs. Uplands: A Genetic Analysis Approach
10 likes | 84 Vues
Investigating microbial communities in wetlands and upland areas using genetic techniques. Results show differences in diversity, richness, and evenness. A protocol for soil microbe analysis was developed. BioLog plates and genomic analysis used for studying microbial populations.

Exploring Microbial Communities in Wetlands vs. Uplands: A Genetic Analysis Approach
E N D
Presentation Transcript
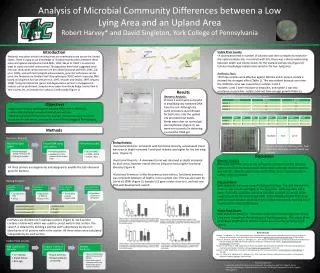
Introduction Wetlands and other similar low lying areas are commonly found across the United States. There is a gap in our knowledge of microbial communities between these areas and upland areas(Garland and Mills, 1991; Zak et al. 1994 ). So what are ways to study microbial communities? BioLog plates have been suggested since they can show what carbon sources can be utilized (Garland and Mills, 1991, Zak et al. 1994), and with technological advancements, genomic techniques can be used, like Temperature Gradient Gel Electrophoresis (TGGE) which separates DNA based on sequence not size (Heuer et al. 1997; Muyzer and Smalla, 1997; Muyzer, 1999). Using 16S ribosomal genes and degenerative primers a metagenomic analysis can be performed. Samples were taken from Rocky Ridge County Park in York County, PA, and beside the Codorus Creek nearby (Figure 1). • Viable Plate Counts: • A downward trend in number of colonies was seen as depth increased for the upland sample site. In contrast with this, there was a direct relationship between depth and colony counts for the lowland sample site (Figure 6) Colony morphology looked more varied in the low lying area. • Antibiotic Tests: • All three isolates were effective against Bacillus and S. aureus. Isolate 2 showed the strongest effect (Table 1). This was evident because over time the inhibition zone was overcome in isolates 1 and 3. • Isolates 1 and 2 were resistant to ampicillin, and isolate 2 was also resistance to penicillin. Isolate 3 did not have enough growth (Table 2). Lowland Upland Figure 1 Map showing the sample locations. Approximate GPS Coordinates for the area: 40.00 N 76.7 W Analysis of Microbial Community Differences between a LowLying Area and an Upland AreaRobert Harvey* and David Singleton, York College of Pennsylvania Results Genomic Analysis: Primers 2 and 3 were successful in amplifying any extracted DNA from the soil. Although the same procedure was followed for both sites, only the upland site provided clear bands. Bands were clear on normal gel electrophoresis (Figure 2), we were not successful in obtaining a successful TGGE gel. Table 1. Results from inhibition tests of other species • Objectives • Begin a preliminary investigation into the difference in microbial communities between an upland and a low land site. • Develop a protocol for soil microbe analysis that can be used to further elucidate the differences, and can be used at York College of Pennsylvania. Table 2. Results from Kirby-Bauer antibiotic resistance analysis Figure 2. Results from the modified DNA extraction. Only primer sets 1 and 2 gave results. All bands are from the upland sample site, no bands were obtained from the lowland site. Methods Surface 6 in 12 in Genomic Analysis • Biolog Analysis: • Functional Richness: Consistent with functional diversity, a downward trend was seen as depth increased. Functional richness was higher for the low lying area. (Figure 3). • Functional Diversity: A downward trend was observed as depth increased for both areas, however overall the low lying area had a higher functional diversity (Figure 4) • Functional Evenness:Unlike the previous two metrics, functional evenness was consistent between all depths, minus sample U12. This was also seen by Zak et al (1994) (Figure 5). Sample U12 gave a value close to 0, and had very little well development overall. Figure 6. Example of a BioLog plate. Each plate had 3 replicates, so each depth was analyzed. Primer Set 3 Primer Set 2 Discussion Genomic Analysis DNA extraction from soil was not sufficiently consistent to allow microbial community diversity measurements to be taken. Although the first objective was not met, there is a preliminary method that can be improved upon in further research projects. BioLog Analysis Both objectives were met using the BioLog technique. The data showed that diversity and richness are higher in low lying sites, while evenness is the same. Anaerobic conditions are more prevalent as depth increased, which could account for the decreasing trends. A streamlined protocol that can be used by future research students at York College was created, meaning future studies can be more results based. Viable Plate Counts Both objectives were met. The more varied colony morphology seen in low lying areas strengthens the conclusion of the BioLog assay. The results of the Kirby-Bauer tests indicate that the isolates are producing some type of β-Lactam. All three primers are degenerate and designed to amplify the 16S ribosomal gene for bacteria. BioLog Analysis EcoPlates are divided into 3 replicate sections (Figure 6). Each section contains a blank well, which was used to correct wells in that section. The value Pi is obtained by dividing a positive well’s absorbance by the sum absorbance of all positive wells in the section. All three values were calculated independently for each section. • References • Garland, J.L. and Mills, A.L. 1991. Classification and Characterization of Heterotrophic Microbial Communities on the Basis of • Patterns of Community-Level Sole-Carbon-Source Utilization. Applied and Environmental Microbiology. 57:2351-2359. • Heuer, H., Krsek, M., Baker, P., Smalla, K., Wellington, E.H. 1997. Analysis of Actinomycete Communities by Specific Amplification of • Genes Encoding 16S rRNA and Gel-Electrophoretic Separation in Denaturing Gradients. Applied and Environmental • Microbiology. 63:3233-3241. • Muyzer, G. and Smalla, K. 1998. Application of denaturing gradient gel electrophoresis (DGGE) and temperature gradient gel • electrophoresis (TGGE) in microbial ecology. Antonie van Leeuwenhoek. 73:127-141. • Muyzer, G. 1999. DGGE/TGGE a method for identifying genes from natural ecosystems. Current Opinions in Microbiology.2: • 317-322. • Zak, J.C., Willig, M.R., Moorhead, D.L., Wildman, H.G. 1994. Functional Diversity of Microbial Communities: A Quantitative • Approach. Soil Biol. Biochem. 26:1101-1108. Viable Plate Counts Acknowledgements I would like to thank Dr. Kleiner for his help with this project, as well as Dr. Hagerty for her input on poster design. I would also like to thank the YCP Biology Department for their support of this project.