Understanding One-Way ANOVA in Psychological Research: Comparing Multiple Groups
This material covers the concept of One-Way Independent ANOVA as a statistical method for comparing differences among three or more groups or conditions. It explains how ANOVA generalizes t-tests, allowing researchers to test hypotheses involving multiple categories, such as different therapies or treatments. The lecture also delves into key aspects such as variance measures, the F-distribution, and conditions for homogeneity of variance. The application of ANOVA in real studies, including its assumptions and reporting results, is systematically presented for better understanding.

Understanding One-Way ANOVA in Psychological Research: Comparing Multiple Groups
E N D
Presentation Transcript
PSYC 6130 One-Way Independent ANOVA
Generalizing t-Tests • t-Tests allow us to test hypotheses about differences between two groups or conditions (e.g., treatment and control). • What do we do if we wish to compare multiple groups or conditions simultaneously? • Examples: • Effects of 3 different therapies for autism • Effects of 4 different SSRIs on seratonin re-uptake • Effects of 5 different body orientations on judgement of induced self-motion. PSYC 6130, PROF. J. ELDER
Reinterpreting the 2-Sample t-Statistic PSYC 6130, PROF. J. ELDER
Reinterpreting the 2-Sample t-Statistic PSYC 6130, PROF. J. ELDER
Example PSYC 6130, PROF. J. ELDER
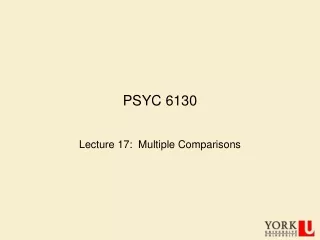
F distribution for 2 groups of size n=13 0.5 0.4 0.3 0.2 0.1 0 0 2 4 6 8 10 The F Distribution PSYC 6130, PROF. J. ELDER
Within and Between Variances • Recall that the variance is, by definition, the mean squared deviation of scores from their mean. • Since the numerator of the t2 statistic estimates the variance from the deviations of group means, it is called the mean-square-between MSbet. • Since the denominator of the t2 statistic estimates the variance from the deviations within groups, it is called the mean-square-within MSW. • These definitions allow us to generalize to an arbitrary number of groups. PSYC 6130, PROF. J. ELDER
Generalizing to > 2 Groups PSYC 6130, PROF. J. ELDER
Degrees of Freedom • Recall that the sample variance follows a scaled chi-square distribution, parameterized by the degrees of freedom. • Thus the F distribution is a ratio of two chi-square distributions, each with different degrees of freedom. PSYC 6130, PROF. J. ELDER
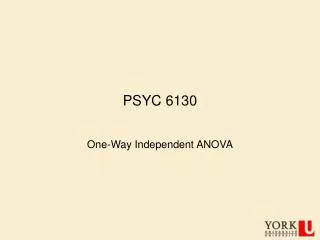
F distribution for 3 groups of size n=13 1 0.8 p(F) 0.6 0.4 0.2 0 0 2 4 6 8 10 Testing Hypotheses PSYC 6130, PROF. J. ELDER
When k=2 • ANOVA will give exactly the same result as two-tailed t-test. • One-tailed tests must be done using t-tests. PSYC 6130, PROF. J. ELDER
Example From the Canadian Generalized Social Survey, Cycle 6 (1992) PSYC 6130, PROF. J. ELDER
Example PSYC 6130, PROF. J. ELDER
Reporting Results • A one-way ANOVA demonstrates that frequency of contact with clinical psychologists depends on marital status. Widowed individuals had the least contact (M=0.082). Married individuals (M=0.185) had somewhat more contact. Single (M=0.620) and separated or divorced (M=0.900) had substantially more contact. F(3,11807)=33.3, MSE = 7.8, p<.001. PSYC 6130, PROF. J. ELDER
Summary Table (SPSS) PSYC 6130, PROF. J. ELDER
Interpreting the F Ratio PSYC 6130, PROF. J. ELDER
Effect Size and Proportion of Variance Accounted For PSYC 6130, PROF. J. ELDER
(Approxiately) Unbiased Effect Size PSYC 6130, PROF. J. ELDER
Reporting Results • A one-way ANOVA demonstrates that frequency of contact with clinical psychologists depends on marital status. Widowed individuals had the least contact (M=0.082). Married individuals (M=0.185) had somewhat more contact. Single (M=0.620) and separated or divorced (M=0.900) had substantially more contact. F(3,11807)=33.3, p<.001. However, the size of the effect was relatively small: PSYC 6130, PROF. J. ELDER
Planning a Study: ANOVA and Power PSYC 6130, PROF. J. ELDER
Example • You are interested in whether there is a link between PSYC 6130 final grades and the professor teaching the section. • Grades typically have a standard deviation of about 15% • There are typically 3 sections, each with around 12 students. • What is the probability you would pick up an effect if the standard deviation of the mean grade is around 5%? PSYC 6130, PROF. J. ELDER
Advantages of ANOVA • Avoid inflation in error rate due to multiple comparisons • Can detect an effect of the treatment even when no 2 groups are significantly different. PSYC 6130, PROF. J. ELDER
6-Step Process for ANOVA • State the hypotheses • Select the statistical test and significance level • Select the samples and collect the data • Find the region of rejection • Calculate the test statistic • Make the statistical decision PSYC 6130, PROF. J. ELDER
Sums of Squares Approach PSYC 6130, PROF. J. ELDER
ANOVA Assumptions • Independent random sampling • Normal distributions • Homogeneity of variance PSYC 6130, PROF. J. ELDER
More on Homogeneity of Variance PSYC 6130, PROF. J. ELDER
Levene’s Test: Basic Idea • SPSS reports an F-statistic for Levene’s test • Allows the homogeneity of variance for two or more variables to be tested. PSYC 6130, PROF. J. ELDER
What to do if Homogeneity of Variance Assumption is Rejected • Some adjustment procedures are available in SPSS (e.g., Welch 1951). • We will not cover the theory behind these adjustments. PSYC 6130, PROF. J. ELDER
Fixed vs Random Effects • Fixed Effects: interested only in the specified levels of the independent variable (e.g., single/married/divorced/widowed) • Random Effects: interested in a large number of possible levels of the independent variable – randomly sampling only a few of these. e.g., • Does the order of questions on a questionnaire effect the results? • Does the order of stimuli in a psychophysical experiment effect the results? PSYC 6130, PROF. J. ELDER
Fixed vs Random Effects • One-Way Independent ANOVA calculation is the same for fixed and random effect designs. • Power and effect size calculations differ. • More complex ANOVA designs differ. • We restrict our attention in this course to fixed effect designs. PSYC 6130, PROF. J. ELDER
Qualitative vs Quantitative Independent Variables • In principle, ANOVA can be applied to either qualitative or quantitative variables. • If IV is quantitative and effect is roughly linear, usually have more power using regression (only using up 2 degrees of freedom, instead of k). • If effect is complex (e.g., non-monotonic): • Use a higher-order regression model (e.g., quadratic) • Use ANOVA (makes no smoothness assumptions) PSYC 6130, PROF. J. ELDER