Species diversity
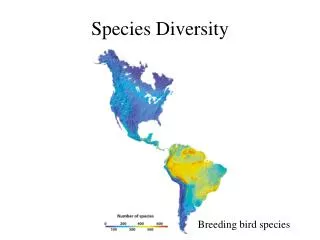
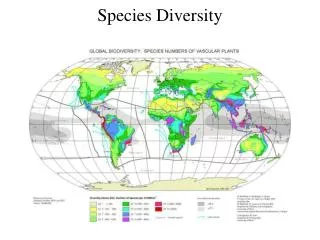
Species diversity. Species diversity : variation in types of organisms present in a community Components of species diversity species richness : number of species present

Species diversity
E N D
Presentation Transcript
Species diversity • Species diversity: variation in types of organisms present in a community • Components of species diversity • species richness: number of species present • heterogeneity or equitability of species: how equally distributed in the community are the abundances of individual species
Measurement of species diversity • Species diversity indices: Table 5B.1, p. 178 • Species richness • number of species in the community • simplest estimate • count only resident species, not accidentals • gives all species same “importance”, regardless of number of individuals present
Measurement of species diversity • Heterogeneity of species in the community • attempt to overcome problem of considering common and rare species as having same “importance” in the community • uses relative abundance
Measurement of species diversity • Heterogeneity of species in the community • e.g., two communities with two species and the same total number of individuals could be comprised of two extremes: Community 1Community 2 Species A 9950 Species B 150 • heterogeneity increases in a community when there are more species and when the species are equally abundant (heterogeneous)
Measurement of species diversity • Shannon-Wiener function • measurement of species diversity using • species richness (number of species) • relative abundance (heterogeneity) H’ = - (pi)[ln(pi)] where H’ = Shannon-wiener index of species diversity s = number of species in the community pi = proportion of total abundance represented by the ith species
Measurement of species diversity Shannon-Weiner species diversity calculations for the two 2-species communities:
Measurement of species diversity • Shannon-Wiener index • values range from near zero to ??? • higher index values indicate higher species diversity • index has no units, has value only when comparing communities • increasing the number of species (s) increases H’ • increasing the equitability (heterogeneity) of the species in the community increases H’
Measurement of species diversity • Evenness • measurement of equitability among species in the community E = H’ / Hmax where E = Pielou’s index of evenness H’ = calculated Shannon-wiener index Hmax = ln(s) = species diversity under maximum equitability conditions s = number of species in the community
Measurement of species diversity • Evenness • values range from 0 to 1 • for the two 2-species communities example: Community 1Community 2 s 22 H’ 0.0560.694 Hmax0.6930.693 E 0.0811.000
Measurement of species diversity • Simpson’s index • measurement of dominance and diversity • uses number of species and relative abundance of species • if two individuals are sampled at random within a community, the probability that the two will belong to the same species is I = ni (ni-1) / N (N-1) where ni = number of individuals of the ith species N = total number of individuals
Measurement of species diversity • Simpson’s index • the quantity I is a measure of dominance or the concentration of N individuals among s species Ds = 1 - I Ds = 1 – [ni (ni-1) / N (N-1)] where Ds = Simpson’s dominance index ni = number of individuals of the ith species N = total number of individuals
Measurement of community similarity • Jaccard’s coefficient of community similarity CCJ = c / (s1 + s2 + sn – c) CCJ = c / S where CCJ = Jaccard’s coefficient of community s1 = number of species in community 1 s2 = number of species in community 2 sn = number of species in communities n c = number of species common in all communities S = total number of species found in all communities
Experiment 2 • Comparative species diversity • small nekton community associated with salt marshes in the Galveston Bay system • objectives • compare species diversity and species composition at one site (Hance Bayou) between two collection times: October 2010 and September 1999 • Shannon Weiner diversity • Pielou evenness, • Jaccard’s coefficient of similarity • Simpson’s dominance • compare fish size (age class) among the three sites • compare differences in biotic indices among sites to differences in physical and chemical environment
Experiment 2 • Comparative species diversity • variables • water quality • salinity • temperature • pH • total dissolved solids (TDS) • physical environment • wind direction and speed • tide level • structures • biological environment
I-45 Virginia Point 3 2 Hance Bayou 1 Christmas Bay
N BIOL 4233 and 5533 Field Trip for Expt 2 Comparative Species Diversity Date: Monday, 10/04/10 Meet at 8:00 am sharp at the Bright Light bait store just west of the San Luis Pass bridge Site 3: Virginia Point I-45 To Houston Map is not to scale! West Galveston Bay Galveston Sportsman's Rd. Site 2: Hance Bayou 61st St. 8-mile Rd. Bright Light Bait Store Stewart Rd. Seawall Blvd. Site 1: Christmas Bay FM3005 Flashing light Gulf of Mexico San Luis Pass bridge $2 toll each way