Download
1 / 52
600 likes | 1.21k Vues
Species Diversity. Biogeography November 7-14, 2007. Ecological Patterns Species diversity Species distributions Island patterns Community distributions. Ecological Processes Competition Coexistence Succession disturbance. Geographical Ecology. Measuring Diversity Scales Richness

E N D
Species Diversity Biogeography November 7-14, 2007
Ecological Patterns Species diversity Species distributions Island patterns Community distributions Ecological Processes Competition Coexistence Succession disturbance Geographical Ecology
Measuring Diversity Scales Richness Diversity Eveness Patterns of Diversity Latitudinal gradients Elevational gradients Precipitation gradients Peninsulas Aquatic environments Processes Explaining Diversity Gradients Historical Disturbance Hypothesis Equilibrium Theories Productivity Climate stability Heterogeneity Biotic interaction Area/distance Diversity in TRF Equilibrium theory Janzen’s hypothesis Non-Equilibrium theory Species Diversity
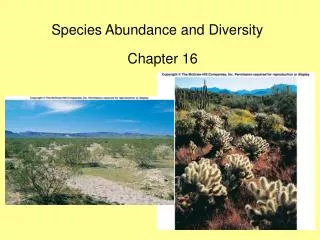
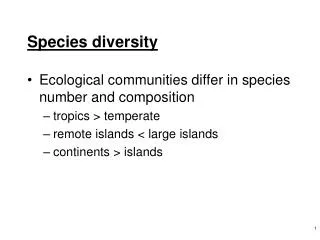
Species Diversity: A Non-Concept? • What determines the number and kinds of species that occur in a particular place? • Why do number and kinds of species vary from place to place?
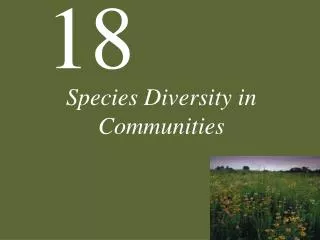
Scales of Diversity • Alpha Diversity • w/in habitat • Beta Diversity • b/w habitat • Gamma Diversity • Total diversity
Sampling area and species richness Relationship b/w sampling area and bird species richness in North America (Fig. 14.1 MacDonald)
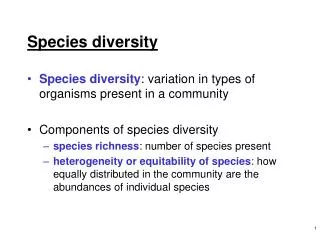
Measuring Diversity • Species Richness • Total number of species in an area • can also be measured as biomass, basal area, % cover • Species Diversity • Considers eveness and richness • Species Eveness • Considers how abundance data are distributed among the species 96 humans, 1 dodo, 1 thylacine, 1 honeycreeper, 1 chuckwalla 20 peccaries, 20 monkeys, 20 leafcutter ants, 20 wasps, 20 lizards
Measuring Species Diversity • Species Richness • The number of species in a given area (N0) • Sample Size Issue! • Margalef Index Mehinick Index R1 = S-1/ln(n) R2 = S/√n Where S = total number of species in area sampled n = total number of individuals observed Interpretation: The higher the index the greater the richness R1 = 1.28 R1 = 1.66 • Example: S = 6 and n = 50 • S = 6 and n = 20
Measuring Species Diversity • Diversity Indices - Simpson’s Index = probability that 2 individuals selected at random will belong to the same species • = i(ni(ni-1))/N(N-1) Where: ni= total number of individuals in each species N = Total number of individuals in all species Interpretation: If probability is high, the diversity of sample is low
Measuring Species Diversity • Diversity Indices - Shannon’s Index H’ H’= -i ((ni/N)ln (ni/N)) Where: ni= total number of individuals in each species N = Total number of individuals in all species Interpretation: 1.5 (low richness/eveness) to 3.5 (high richness and eveness)
Hill’s Family of Diversity Numbers • Units are given in numbers of species NO = total number of species in the sample N1 = the number of abundant species N2 = the number of very abundant species N1 = eH’ (H’=Shannon’s index) N2 = 1/ (=Simpson’s index)
Measuring Species Diversity • Species Eveness How abundance data are distributed among species 96 humans, 1 dodo, 1 thylacine, 1 honeycreeper, 1 chuckwalla 20 peccaries, 20 monkeys, 20 leafcutter ants, 20 wasps, 20 lizards Modified Hill’s Ratio E5 = N2-1/N1-1 Where: N1 = eH’ N2 = 1/ Interpretation: 0 = less even, 1 = more even
Desert Lizard Diversity Number of individuals for each of 6 species of lizards counted in a 1 hectare plot
Desert Lizard Diversity Richness Diversity Eveness NO = = E5 = R1 = H’ = R2 = N1 = N2 =
Desert Lizard Diversity Richness Diversity Eveness NO = 6 = 0.31 E5 = 0.80 R1 = 1.44 H’ = 1.33 R2 = 1.06 N1 = 4 N2 = 3
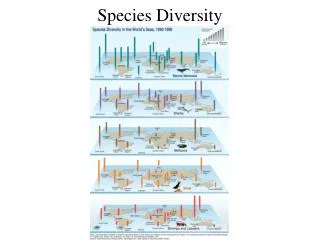
Patterns of Diversity • Latitudinal Gradients • Elevation Gradients • Precipitation Gradients • Peninsulas • Aquatic Environments
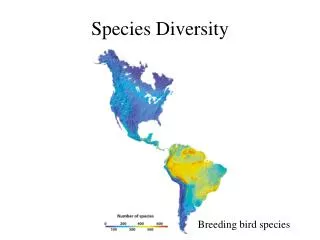
Mammals Birds
Processes Explaining Diversity Gradients • Historical Disturbance Hypothesis - landscape reflects historical events, not current environmental conditions (not in equilibrium) Habitats catastrophically disturbed are “undersaturated” in terms of species because there hasn’t been adequate time for adaptation and speciation Problems: evidence from tropics
Processes Explaining Diversity Gradients • Equilibrium Theories • Landscape is a reflection of current environmental conditions (in equilibrium) • Productivity • Climate stability-Harsh habitat • Habitat heterogeneity • Biotic interactions • Large Area
Processes Explaining Diversity Gradients • Productivity • What is the link b/w productivity and biodiversity? • Tropics 2200 g/m2/yr • Temperate 1200 g/m2/yr • Boreal 800 g/m2/yr • Scale • Estuaries, marshes are most productive ecosystems on earth, with lowest diversity
Processes Explaining Diversity Gradients • Climate Stability (Harsh Habitat) • Environments with low stability are harsher and are less diverse • Why? • Exceptions • Areas with stable climate but low diversity
Processes Explaining Diversity Gradients • Habitat Diversity (Heterogeneity) • What is the link? • Is it a direct relationship?
Processes Explaining Diversity Gradients • Biotic Interactions • Is speciation driven by competition in low lats and adaptation to physical stress in high lats? • Exceptions: trees/plants • What about predation as a mechanism? • Circularity
Processes Explaining Diversity Gradients • Large Land Area • Supports more individs • Supports more species • Tropics? Boreal?
Diversity in TRF and Coral Reefs • Equilibrium Viewpoint • Stability is the major characteristic of a community. Following disturbance, it recovers and high diversity is maintained by a variety of mechanisms. Community reflects current conditions. • Non-Equilibrium Viewpoint • Communities rarely reach an equilibrium state and high diversity results from changing environmental conditions.
Diversity in TRF • Janzen’s Hypothesis (1970): Biotic interactions - host-specific herbivores - seed predation - canopy foliovores • Hubbell’s research (1979, 1980) to support Janzen • Non-equilbrium explanation (Connell 1978) - coral reefs
The Non-Equilibrium Hypothesis (Connell 1978) • Intermediate Disturbance Hypothesis