Healthcare Data Analysis and Trends in Participating States
160 likes | 245 Vues
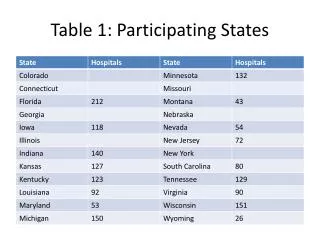
Explore data on specific diagnoses, inpatient care, ED visits, and more across different hospital types and bed sizes to identify trends and insights in healthcare services.

Healthcare Data Analysis and Trends in Participating States
E N D
Presentation Transcript
Table 2: Specific Diagnoses • Inpatient • PQI #1 – Short-term consequences of diabetes • PQI #7 - Hypertension • PQI #12 - Urinary tract infection • Knee replacement (ICD-9 Procedure Code 81.54) • ED • Urinary Tract Infection (ICD-9 Dx 5990) • Headache (ICD-9 (Dx 7840) • Upper Respiratory Infection (ICD-9 (Dx 465, 4658, 46659)
Table 3. Hospitals by type HospitalTyp | e | Freq. Percent Cum. ------------+----------------------------------- A | 1,114 62.13 62.13 C | 517 28.83 90.96 O | 63 3.51 94.48 S | 99 5.52 100.00 ------------+----------------------------------- Total | 1,793 100.00
Table 4. Bedsize categories • Bedsize Categories Freq. Percent Cum. • -------------------+----------------------------------- • Less than 200 beds | 1,298 74.47 74.47 • 200-399 beds | 306 17.56 92.03 • 400+ beds | 139 7.97 100.00 • -------------------+----------------------------------- • Total | 1,743 100.00 • .
T. 15 Inpatient admissions: Percent self-pay by Medicaid expansion status
T. 16 ED visits: Percent Self-Pay by Medicaid Expansion Status