Inference for Population Proportions: Estimation, Comparison, and Confidence Intervals
90 likes | 203 Vues
This section covers inference for population proportions, focusing on estimating a single proportion, comparing two or more proportions, and creating confidence intervals. The key concepts include understanding the sampling distribution of the sample proportion (p-hat), standardizing p-hat into a z-value, and applying z-procedures. Assumptions for valid inference, such as SRS and sample size conditions, are also discussed. Examples include calculating confidence intervals and hypothesis tests, providing practical applications for analyzing population proportions.

Inference for Population Proportions: Estimation, Comparison, and Confidence Intervals
E N D
Presentation Transcript
Inference for a Population Proportion Section 12.1
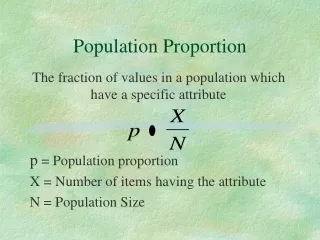
Inference for Proportions • To estimate a single population proportion. • To Compare two population proportions. • To Compare more than two population proportions (Chapter 13). • Remember p = population proportion (success). • Estimate p using p-hat (sample proportion).
Sampling Distribution of p-hat • Mean of p-hats = p, so p-hat is an unbiased estimator of p. • Standard Deviation of p-hats = √pq/n • Approximately normal for large samples. • To standardize p-hat into a z value: z = (p-hat – p) / √pq/n • Use p0 for p in tests. • Use p-hat for p in confidence intervals (SE). • Confidence Interval: p-hat ± z*SE
Assumptions: • Data are an SRS. • N ≥ 10n. • np0 ≥ 10 or np-hat ≥ 10 • nq0 ≥ 10 or nq-hat ≥ 10 • Look at page 663 to see what practical issues arise.
Z-Procedures • Confidence Interval: p-hat ± z* √(p-hat)(q-hat)/n • Hypothesis Test: z = (p-hat – p0) / √p0q0/n • H0: p = p0 • Ha: p > p0 • Ha: p < p0 • Ha: p ≠ p0
Example: Heterosexuals • In a sample of 2673 adult heterosexuals 170 had multiple partners. P-hat = .0636. Find a 99% confidence interval for the proportion of all adult heterosexuals who have multiple partners. • (.0514, .0758) • Interpret results. • Calculator.
Example: Count Buffon • Count Buffon tossed a coin 4040 times and got 2048 heads. P-hat = .5069. Was Buffon’s coin unbalanced? • Hypotheses • Assumptions • Test: z statistic and p-value • z = .88, p-value = .3788 • Summarize results. • Do a 95% confidence interval. • (.4915, .5223)
Choosing a Sample Size • If we want a certain margin of error at a certain confidence level: Margin of Error = z*se. We don’t know p-hat since we have not done a sample yet so either use .5 for p-hat or do a test sample and use its p-hat.
Example: Voting • What % of voters will vote for a certain candidate? Need an SRS and want a 95% CI and margin of error ≤ 3%. What sample size is needed? • n ≥ 1067.1, so 1068.