High-Resolution Spectral Analysis for COS Preship Review
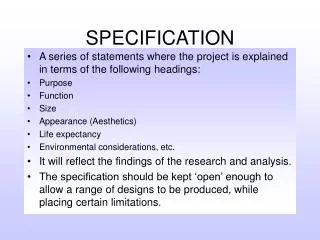
Detailed resolution specifications and results for various FUV and NUV settings as part of COS Preship Review tests, ensuring accuracy and quality. Alignment issues addressed. Data fidelity confirmed.

High-Resolution Spectral Analysis for COS Preship Review
E N D
Presentation Transcript
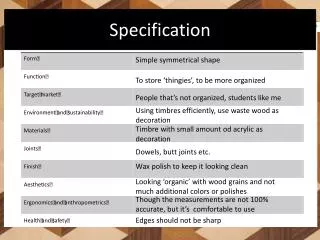
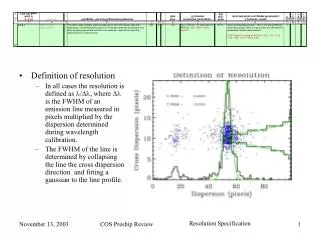
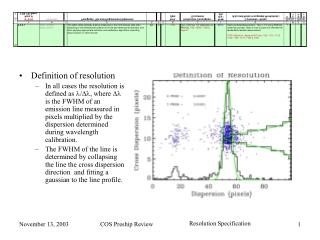
Definition of resolution • In all cases the resolution is defined as l/Dl, where Dl is the FWHM of an emission line measured in pixels multiplied by the dispersion determined during wavelength calibration. • The FWHM of the line is determined by collapsing the line the cross dispersion direction and fitting a gaussian to the line profile. COS Preship Review Resolution Specification
FUV resolution measured as part of Test 1110 • Qualitatively speaking, those lines with very low or very high spectral resolution tend to have few counts. Bright lines generally exceed spectral resolution requirements. COS Preship Review G130 Resolution
FUV resolution measured as part of Test 1110 COS Preship Review G160 Resolution
FUV resolution measured as part of Test 1110 COS Preship Review G140 Resolution
Point of note • Individual wavelength settings for the NUV channel cover non-contiguous parts of the full NUV spectrum. • Multiple grating settings are required to sample the full wavelength coverage of each NUV grating. COS Preship Review NUV Wavelength Coverage
G185M resolution • Measured during Appendix B, Tests 1160 & 1155 • Initial results from Test 1160 found lower than expected resolution. This was attributed to misalignment between RAS/Cal & COS • Resolution tests repeated in GN2 environment during Test 1155 at ambient thermal environment existed. • Resolution meets specifications over measured band-pass. Shorter wavelengths could not be observed in GN2 environment. • G185M band-pass is from 1670-2127Å. 80% of this band-pass is 1760-2127. ? 80% Symbols refer to OSM2 wavelength settings Multiple settings are required to cover entire band-pass COS Preship Review G185M Resolution
G225M resolution • Measured during Appendix B, Tests 1170 & 1156 • Initial results from Test 1170 found lower than expected resolution. This was attributed to misalignment between RAS/Cal & COS • Resolution tests repeated in GN2 environment during Test 1156 at ambient thermal environment existed. • Resolution meets specifications Symbols refer to OSM2 wavelength settings Multiple settings are required to cover entire band-pass COS Preship Review G225M Resolution
G285M resolution • Measured during Test 1180 • Resolution meets specifications Symbols refer to OSM2 wavelength settings Multiple settings are required to cover entire bandp-pass COS Preship Review G285M Resolution
G230L resolution • Measured during test 1190 • Resolution meets specifications over most of the band-pass • Band-pass is 1700-3200Å. 80% is 2000-3200Å. 80% COS Preship Review G230L Resolution
FUV02 meets QE specifications (UCB memo COS-021217-JV). • Visible light rejection is 1x10-12 and 4x10-11 (ref. UCB memo COS-031027-JBM). • Absolute efficiency measurements are based on a calibrated photodiode, so the absolute error ~10%. COS Preship Review FUV Detector Requirements
Digitized pixel size is described in UCB memo COS-031027-JBM. Pixel sizes in final data are 6x24 microns. • Dispersion and cross-dispersion resolution are shown to the right and discussed in UCB memo COS-031027-JBM. • Detector x-resolution for segment A does impact net spectral resolution. COS Preship Review FUV Detector Requirements
XDL dark rate measured during to be ~0.425 counts/sec/cm2 (UCB memo COS-031027-JBM), exceeding the 0.5 counts/sec/cm2 specification. • XDL maximum global and local rate discussed in UCB memos COS-031027-JBM, COS-010807-JV, and COS-010404-JVV. Requirements are met. COS Preship Review FUV Detector Requirements
FUV Flat Field Data • Evaluation of the FUV flat field is progressing. The histograms to the right show the distribution of pixel-to-pixel variations in the p-flats for segment A & B. (FUV detector meets flat field uniformity specification) • Stability of the flat field with charge extraction is under investigation. Quick look analysis showed no appreciable difference in the PHD after the deep flat fields were acquired. This is an ongoing investigation. COS Preship Review FUV Detector Requirements
Specification listed in CEI corresponds to <100%/C/cm2, the rate of change of the modal gain with charge extraction, assuming the DRM. • FUV02 MCPs were scrubbed to <100%/C/cm2, so they meet the specification. • Results and test description can be found in UCB memos COS-031027-JBM and COS-991208-JV. COS Preship Review FUV Detector Requirements
Results presented in UCB memos COS-031027-JBM and UCB-COS-RPT-1164 Rev A. • Focal plane matching meets requirements. COS Preship Review FUV Detector Requirements
Results from Test 2170 • O2 absorption spectrum • Final spectrum consists of multiple individual spectra that were cross-correlated and co-added. • Individual spectra consisted of multiple FP-Split exposures • Data were flat fielded as well. • SN in the continuum exceeds 100. COS Preship Review NUV Detector Requirements
Per COS-NUV-001, the lifetime requirement placed on the NUV detector when it was built is “10% DQE loss at >8x10¹⁰ counts/mm2”. • This specification corresponds to 5x10⁷ counts/pixel • The NUV channel uses 3 stripes, each 3x1024 pixels = 9216 total pixels • This means that the NUV detector will suffer a 10% loss in DQE when it has observed 4.6x10¹¹ events TOTAL in the 3 spectral stripes. • The DRM (COS ISR 99-01) states that the NUV channel can expect to see 1.4x10⁹ counts over the lifetime of the mission. • This is 2 orders of magnitude below the value at which the NUV detector will experience a 10% loss of DQE. • Finally, the three spectral stripes for each channel do not fall on the same region of the detector, thus increasing the number of pixels used and decreasing the net counts/pixel. • It is reasonable to assume that the NUV lifetime will support the lifetime requirements. • The re-entrant window in the NUV channel was polished to <l/4 at 6328Å as stated in the certification logs. • The re-entrant window defines the focal surface of the detector. l/4 = 158 nm << 0.1 mm, thus the NUV detector focal plane meets requirements. COS Preship Review NUV Detector Requirements
GSFC IVT verified the alignment of CAOS and RAS/Cal prior to each major alignment or test activity. • No reports describing the alignment have been issued by the IVT at this time. COS Preship Review Optical Stimulus Requirements
COS Preship Review COS Wavelength Coverage
COS wavelength scales extend across required wavelengths FUV NUV COS Preship Review COS Wavelength Coverage
NUV Accuracy • Data from wavecals that accompanied external Pt-Ne tests 1160, 1170, 1180. • The measured stripe B central wavelength was within … • ± 5 resels 68% • ± 10 resels 88% • ± 15 resels 100%. COS Preship Review Accuracy Requirement - NUV
NUV Repeatability • Comparison of repeated visits to same setup position. 107 spectra in 14 groups (grating, setup l , FPSPLIT). Cross-correlation using 1 spectrum as reference. 3 stripes averaged. Assume 1 resel = 3 NUV pixels. • Repeatability is • ± 1 resel 77% of cases • ± 6 resels 100%. COS Preship Review Repeatability Requirement - NUV
FUV Accuracy • 5 supported OSM1 setup positions • Each allows 4 FPSPLIT offsets of 1 mechanism step each • Measured wavelengths are within required range COS Preship Review Accuracy Requirement - UFV
FUV Repeatability • Comparison of repeated visits to same setup position. 47 spectra in 11 groups (grating, setup l , FPSPLIT). Cross-correlation using 1 spectrum as reference. Seg A & B averaged. Assume 1 resel = 6 FUV pixels. • Repeatability is… • ± 1 resel 39% of cases • ± 6 resels 100%. COS Preship Review Repeatability Requirement - FUV
Test # 850 was developed and run as a repeatability monitor Test was run four times during Appendix B phase. The same exposures are included in the System Functional Test, and will be obtained each time the FT is run. COS Preship Review 850 Repeatability Test
FUV, G160M, Seg B wavecal centroids 1s~4 pixels FWHM 1s~0.4 pixelsbrightness 1s~ 2% Analysis by Scott Friedman COS Preship Review 850 Repeatability Test
NUV, G185M, Stripe B wavecal centroids 1s~3.5 pixels FWHM 1s~0.2 pixelsbrightness 1s~ 3% Analysis by Scott Friedman COS Preship Review 850 Repeatability Test
This requirement addresses two issues • That the residuals in the wavelength calibration are << 15 km/s • That applying the wavelength calibration as determined from the wavelength calibration spectrum with an appropriate offset in the a0 term of the wavelength solution to the science spectrum does not introduce error greater than 15 km/sec in the absolute wavelength scale (1 resolution element). • 1 NUV pixel = ~4 km/sec • Residuals in wavelength scale meet requirements. G285 - C Stripe, lcen=2850Å COS Preship Review Wavelength Scale Requirements
Residuals are <3 FUV pixels (~6 km/sec) rms=1.2 pixels rms=0.8 pixels COS Preship Review FUV Wavelength Scale Residuals
Applying an internal (WCA) wavelength solution to external (PSA) data (45 lines) yields an average error of… • 0.26 ± 1.12 pixels, or • 0.04 ± 0.19 spectral resels. COS Preship Review Errors in offset wavelength calibration
Efficiency measured at more than 5 wavelengths for all FUV and NUV channels. • Appendix A test 400, July 05 • Appendix B test 1210, Oct 11 COS Preship Review G130M Efficiency
Appendix A test 400, July 05 Appendix B test 1220, Oct 11 COS Preship Review G160M Efficiency
Appendix A test 400, July 05 Appendix B test 1230, Oct 11 This point falls outside the specified wavelength range and thus does not violate requirements. COS Preship Review G140L Efficiency
Appendix A test 450, July 03 • Appendix B test 1250, Sept 22 • Appendix B test 1255, Sept 24 • Note: The new CEI values for the NUV channels are values that have been submitted as a change request, NOT a waiver. These new values were rederived after an over-sight made early in the development of COS was discovered. Basically, when the NUV channel was broken into three channels from two the CEI values were copied not rederived. No prior knowledge of the as-built component efficiencies was assumed. 6 of 8 of the values actually increased compared to current values in CEI. COS Preship Review G185M Efficiency
Appendix A test 450, July 03 • Appendix A test 450, July 05 • Appendix B test 1260, Sept 21 • Appendix B test 1255, Sept 24 • The procedure for monitoring the stability of the G225M grating is written and is being routed for signatures (COS-05-0004). • Note that G185M channel can be used to observe the short wavelength portion of the G225M band-pass with higher efficiency. COS Preship Review G225M Efficiency
Appendix A test 450, July 03 Appendix A test 450, July 05 Appendix B test 1270, Sept 21 COS Preship Review G285M Efficiency
Appendix A test 450, July 03 Appendix B test 1280, Sept 22 COS Preship Review G230L Efficiency
BOA Transmission measured during Tests 3310, 3310A, and 3300. • The BOA is ~ND2.5 • Meets requirements COS Preship Review BOA Transmission
G185M • 2nd order band-pass lies completely below 1150Å Al/MgF2 cut-off • G225M • No order sorter: 2nd order efficiency was predicted to be very low due to low reflectivity of coatings [a] • Only grating where 2nd order efficiency was measured • 2nd order efficiency measured during test 1265. • G225M, l = 1248 (no order sorter) detected in m=2 with efficiency = 0.0004. l = 2487 detected in m=1 with efficiency = 0.03. Ratio = 0.013. • G285M & G230L • 2nd order measured, but not fully analyzed • G285M, G230L (with order sorters) did not detect l = 1248. Upper limit of efficiency = 1.2x10⁻⁵. • TA1 • FUV efficiency measured during test 1290. • Efficiencies were almost unmeasureable due to two passes through the order sorter • TA1BRT • FUV efficiency measured during test 1295 • Efficiencies higher than for TA1 due to 5% front surface reflectivity [b] COS Preship Review Out of Band Response
NUV performance measured during Test 2250 and Test 150 10 pixels = 250 mm COS Preship Review NUV Spatial Imaging
10 pixels = 240 mm • G160M performance measured during Test 2731 • 7x7 pinhole array • 338 um (1”) spacing in spatial dimension • 100 um in spectral dimension COS Preship Review FUV Spatial Resolution
Data taken at the component level has been used to demonstrate the ability to achieve SN>100. • Data taken during Tests 1700 and 3000 (flat field spectra taken with onboard D2 lamps) and Test 2120 (CO absorption spectra). • G130M used to derive flat field for FUV segment A • G160M used to derive flat field for FUV segment B • Absorption spectra sufficient to demonstrate SN~70. The test was cut short due to the detection of ~10% drop in the flux from the onboard D2 lamps. • Can easily meet 30:1 requirement • Evaluation of component level flat field data suggests we can achieve 100:1 • Analysis of data acquired during final calibration is ongoing. COS Preship Review FUV Signal to Noise Requirements
The achieved signal to noise under different assumptions • We are actively working on developing the p-flats necessary to increase the signal to noise further. COS Preship Review FUV Flat Field Data
The next few slides summarizes a an analysis conducted for FUV02 based on component level flat fields that demonstrates we can expect to achieve SN 100:1. • The data set presented was taken prior to delivery of FUV02 and after the final scrub of the MCP stack was completed. • ~29 hours of data were taken, or about ~1x10⁹ events/segment. All data was taken as event lists. 108 files were processed. • No special environmental conditions were imposed on the test, so the temperature of the detector and electronics varied several degrees during the data acquisition. • For this analysis the data were thermally corrected and then the data was divided into two halves (image 1 and image 2). • Image 1 was then divided by image 2 and the statistics of the residuals were analyzed to evaluate the stability and noise characteristics of the flat field images. • In addition, FPSPLITs observations - the nominal observing mode - was simulated by shifting and adding 4 copies the same spectrum. The residuals were then evaluated and an effective signal to noise computed. COS Preship Review Component Level Results
A portion of the two flat field images of segment A (7000<xpixel<9400). • Image 1 is divided into Image 2 to evaluate our ability to flat field segment A. Image 1 Image 2 COS Preship Review Images of Segment A Component Level Results
Flat Fielded Images for A • This images is the result of dividing image 1 by image 2 for segment A. Segment A Note the lack of structure evident in the residuals. COS Preship Review Component Level Testing
Description of the Data Products Histogram of the ratio of image 1 to image 2 for the full image between x pixels 7000 and 9400. Histogram of the ratio of image 1 to image 2 for the spectral region per 6x12 pixel resolution element (RE). The width of the distribution is smaller because there are more counts per spectral bin compared to the counts per image bin. Histogram of the ratio of image 1 to image 2 for the spectral region. Note: The fact that the two histograms are identical in width suggests that noise is identical for the full detector image and extracted region. ~250 mm high Spectral region Cross-dispersion Direction Dispersion Direction COS Preship Review Component Level Testing
Histogram of Flat Field - A • Left is the histogram for the full detector. Right is the histogram for the spectral stripe only. • Each plot is extracted from the divided image shown earlier. • The computed SN (45:1) is consistent with our expectations based on the error analysis of dividing two images. • Conclusion: We are able to flat field the FUV data to the limit of photon statistics. COS Preship Review Component Level Testing
+ = + + Simulated FPSPLITS - A • Effective photon limited SN ~ 126 per image. • The measured SN~91 is consistent with the back of the envelope prediction of SN~89. • The computed signal to noise is consistent with the gains expected by averaging 4 data sets. • This indicates that the current plan for reducing the fixed pattern noise through standard FPSPLIT observations will work. COS Preship Review Component Level Testing
All flat field data acquired using G185M mode. • NUV flat field data taken during Tests 1750, 2505, 1750 & 2506. • High quality O2 absorption spectra taken during Test 2170. • Data from 2170 demonstrates SN>100. • Data acquired using G185M, lcen=1817Å. • Demonstration of SN>100:1 means that we can meet all 30:1 requirements. • All NUV SN requirements met. COS Preship Review NUV Signal to Noise Requirements