Download
1 / 57
570 likes | 747 Vues
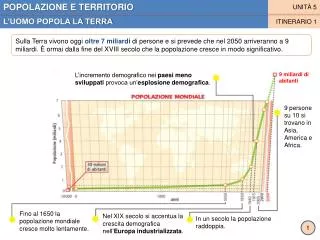
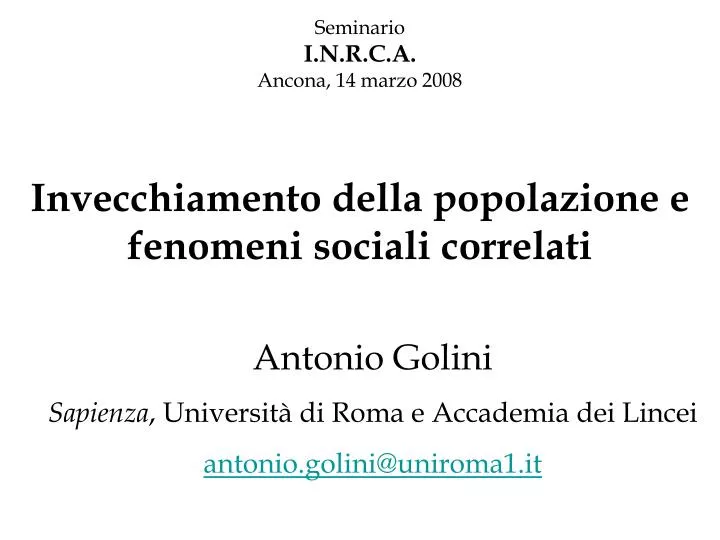
Seminario I.N.R.C.A. Ancona, 14 marzo 2008 Invecchiamento della popolazione e fenomeni sociali correlati. Antonio Golini Sapienza , Università di Roma e Accademia dei Lincei antonio.golini@uniroma1.it.

E N D
SeminarioI.N.R.C.A.Ancona, 14 marzo 2008Invecchiamento della popolazione e fenomeni sociali correlati Antonio Golini Sapienza, Università di Roma e Accademia dei Lincei antonio.golini@uniroma1.it
L’allungamento della vita è stato negli ultimi decenni così intenso e rapido da superare qualsiasi previsione o proiezione che era stata fatta negli ultimi decenni secolo scorso. In particolare, come è ben noto, non si è allungata la durata massima della vita umana dei singoli individui, nel senso che resta assolutamente straordinario il raggiungere o superare i 110 anni, ma si è allungata la durata media della vita di una intera popolazione essendo stata eliminata quasi completamente la mortalità precoce, ed essendo quindi diventato straordinario il numero di persone che riesce a superare gli 80 , 90 anni.
Length of life (years) by major development groups, 1950-55/2005-10
Popolazione 60 anni e oltre (milioni). Africa, Ue 27, Russia, Cina e India. 1950-2005 e proiezioni al 2050 (variante media) Fonte: elaborazione propria su dati Onu, World Population Prospects. The 2004 Revision, New York, 2005
Popolazione 15-59 anni (milioni). Africa, Ue 27, Russia, Cina e India. 1950-2005 e proiezioni al 2050 (variante media) Fonte: elaborazione propria su dati Onu, World Population Prospects. The 2004 Revision, New York, 2005
Popolazione 0-14 anni (milioni). Africa, Ue 27, Russia, Cina e India. 1950-2005 e proiezioni al 2050 (variante media) Fonte: elaborazione propria su dati Onu, World Population Prospects. The 2004 Revision, New York, 2005
Current and future aging of the population: it will be unavoidable, but less rapid where it is currently more intense and vice versa. Percentage of 60+ at 2006 and its increase between 2006 and 2050 Fonte: elaborazione propria su ONU, 2006
A synthesis of the population aging, 2006 e 2050 Fonte: elaborazione propria su ONU, 2006
Un approfondimento del processo demografico che caratterizzerà il XXI secolo: l’invecchiamento della popolazione e della forza lavoro. Una sfida per le società e le economie, ma anche una opportunità per il business
Età massima individuale alla morte 110 in 1973 (first supercentenarian, a woman from Lazio) 111 in 1991 (a man from Calabria) 112 in 2002 (a man from Sardinia) 113 in 2003 (a woman from Puglia) Barbi et al. (2005) E. Barbi: “Il prolungamento della vita umana: realtà, prospettive, problemi”
La malattia(% di persone con almeno 1 malattia cronica che dichiarano di sentirsi “in buona salute”, 2007)
La morte(morti di 90 anni e oltre per stato civile e sesso, 2004)
Sopravviventi a 65 anni e loro ulteriore aspettativa di vita, Giappone,1951 e 2005, e Italia, 2003Fonte: per il Giappone: http://www.ipss.go.jp/p-info/e/S_D_I/Indip.html Per l’Italia: Istat, Annuario statistico italiano 2006
LE PROSPETTIVE PER LA LONGEVITA’ DEGLI INDIVIDUI • B. possibili discontinuità negative • effetti negativi di accumulo di fenomeni di inquinamento dell’aria, dell’acqua, del cibo; • effetti iatrogeni di medicine prese lungo decenni per contrastare le malattie croniche; • comparsa di nuove, inattese e impreviste epidemie (come può succedere o è successo per l’AIDS, per il virus H5N1, nuove forme di tubercolosi); • eccessiva “venerazione” del corpo; • accresciuta diffusione di droghe, doping, obesità soprattutto fra le giovani generazioni; • mutamenti climatici di larga scala; • insostenibilità del sistema di welfare legata all’invecchiamento della popolazione e/o crisi economiche. • possibili discontinuità positive • successi sostanziali e ricorrenti nella ricerca di base (con particolare riferimento alla bio-genetica e alle biotecnologie); • cure efficaci, semplici, economici e facilmente accessibili legate alle cellule staminali, all’ingegneria genetica e alle nanotecologie; • strumenti diagnostici ancora più efficaci e affidabili; • medicine testate su e prodotte per anziani e vecchi; • attività fisica lungo l’intera vita e maggior cura per il corpo; • più intensa attività preventiva legata a miglioramenti nella nutrizione e negli stili di vita.
L’invecchiamento delle famiglie
The coexistence of several generations in a household of a Western country and not only
Una struttura della famiglia così invecchiata pone anche il problema di quale sia il contesto psicologico e sociale nel quale cresce il bambino, problema più che mai grande se i genitori sono separati o divorziati. E quindi in prospettiva si pone il problema di che tipo di genitori sapranno essere questi bambini (e in particolare che tipo di padri, per i figli di divorziati affidati quasi sempre alla madre).
The multiplication of the coexistence of several generations The multiplication of one-child or childless (somebody now says childfree) families requires more and more the growth of an intra-generational solidarity among elderly, to be implemented side by side with the traditional inter-generational one
A rough evaluation of three co-existent generations (population aged 20-24, 45-49, 70-74; in thousands), 1950-2050, Italy, France, China, India Source: UN, World Population Prospects. The 2004 Revision (medium variant), New York,2006
Di alcune conseguenze biopsicosociali 1/3 Con l’allungamento della vita e la mobilità straordinariamente crescente, aumentano, in via formale e informale, sincronica e diacronica: • Il numero di partner nella vita; • Il numero di famiglie nella vita • Il tipo e il numero di lavori nella vita; • Il numero di residenze nella vita. Saper gestire, individualmente e collettivamente, queste straordinarie trasformazioni è, e sarà, questione fondamentale per il benessere psicofisico degli individui
Di alcune conseguenze biopsicosociali 2/3 Con l’allungamento della vita e la mutata epidemiologia sanitaria e sociale sono destinati ad aumentare: • il numero e la proporzione di malattie (in particolare le varie forme di demenza) che richiedono particolare e prolungata assistenza; • il numero e la proporzione di morti per tumore e malattie cardiocircolatorie in età molto avanzata; • Il numero e la proporzione di disturbi cognitivi, anche severi; • Il numero e la proporzione di disturbi di personalità, legati fra l’altro alla possibile difficoltà individuale di gestire le ripetute e intense transizioni della vita (di cui si è detto prima);
Di alcune conseguenze biopsicosociali 3/3 Con l’allungamento della vita e la mutata struttura della popolazione sono destinate ad aumentare: • La difficoltà di assicurare ai vecchi adeguata assistenza sanitaria e sociale (compresa quella burocratico-amministrativa), particolarmente complessa per le persone che vivono sole; • La difficoltà di adattamento, specie per le persone anziane e vecchie, a una crescente presenza di stranieri e a una crescente multiculturalità; • La difficoltà di assicurare ai giovani adeguate politiche per il loro sviluppo, per il rischio che le politiche fatte da anziani e vecchi tendano a proteggere eccessivamente loro stessi (il che in parte avviene già adesso con l’azione dei sindacati) • Le distanze fra le generazioni anche a causa della pervasive, massicce e continue innovazioni tecnologiche .
Net financial position of the different age groups/cohorts in public administration accounts, Italy (data from Sartor, 2003)
(c) (a) (d) (d) (b) (e) (1) (2) Time Time (a) Possible trends in human and other resources according to a balance situation (b) Possible trends of young population (c) Possible trends of old population (d) Possible imbalances between demand and supply (e) Possible trends in human and other resources according to a balance situation A tentative scheme of imbalance between a population of specific age-groups and human resources (i. e. teachers, paediatricians, geriatricians, nurses, etc.)
Demography, aging and GDP GDP Employed WAP GDP = ------------- * ---------------- * ------------- * Population Employed Working Age Population Population |productivity| | economic components ||demographic components| Fonte: Leanza, 2005
GDP (current US$) in billions, 2004 source: World Bank Employed in millions, 2004 source: USA, ILO; ITALY, ISTAT WAP (population. aged 20-59) in millions, 2005 source: UN, population estimates Population in millions, 2004 source: World Bank Demography, aging and GDP GDP Employed WAP GDP = ------------- * ---------------- * ------------- * Population Employed Working Age Population Population 11,711.8 139.3 164.9 11,711.8 = --------- * --------- * -------- * 293.7 USA 139.3 164.9 293.7 1,677.8 22.4 32.2 1,677.8 = --------- * --------- * -------- * 57.6 ITALY 22.4 32.2 57.6 11,711.8 84.1 0.845 0.561 293.7 USA ------------ = --------- * --------- * ---------- * --------- ----------- 1,677.8 74.9 0.696 0.559 57.6 ITALY USA 6.98 = 1.12 * 1.21 * 1.00 * 5.10 ----------- ITALY
Population by broad age group: less than 15, 15-59, 60 and over Italy, 1950-2050 medium variant) Source: UN, World Population Prospects. The 2002 Revision (medium variant), New York,2003
ITALIAN OLDER WORKERS: EXIT AGE + EMPLOYMENT RATE ARE TOO LOW 64 Sweden Switzerland Portugal 63 Ireland 62 UK Netherlands Spain Ø=60.5 61 Finland Denmark Germany Italy Czech Rep. Average exit age of labor force 60 Lux. Austria Greece Hungary 59 France Belgium 58 Slovakia Poland 57 Ø=41% Stockholm Target* 56 20 30 40 50 60 70 Employment rates of older workers (% of pop. 55-64) *EU “Stockholm” target: increase employment rate of 55 – 64 year olds to 50% by 2010 Source: EU Commission; BfS; Avenir Suisse; Murray Gendell; US CRS; Team analysis
Numero medio di ore lavorate per lavoratori di 50 + in alcuni paesi europei Fonte: indagine Share
Il mercato del lavoro Una conclusione che dal versante demografico sembra chiara: in presenza di una più o meno forte attesa diminuzione della popolazione in età lavorativa, occorre lavorare tutti di più e più a lungo. Far crescere la produttività anche per questa via contribuisce a far crescere l’economia e quindi i posti di lavoro, pure di medio-alto profilo per i giovani, mantenendo alta l’occupazione dei giovani anziani
EU DEMOGRAPHIC REVOLUTION IS ALREADY HERE • In the next 10 years the EU will see dramatic growth in the older population, e.g. • Across Europe, for the first time, people over 40 will be in the majority (in Italy and Germany they will be 60% of the population) • France will have 20% more people aged 60+ • Spain and Germany will have 20-25% more in their 50s • ... and many fewer young people e.g.: • Spain will see a 50% fall in people aged 20-35 (a 60% drop for 25-29 years) • Italy will have fewer people in literally every age group from birth to 44 years, with one quarter less in their 30s • The UK will see a big fall in 30s, early 40s (with a 20% drop in 35-45 year-olds) Source: International Labor Organization (ILO), Laborsta data base, Oct 2006
DEMOGRAPHIC CHALLENGE – COMPANY EFFECTS Some European Examples Air France: In 2002, it had 8,600 workers aged over 50. In 2010 it will be 16,500 BASF: Today 55% of the workforce are aged between 35 and 50, but in 2020 the large majority (two thirds !) will be 50 to 65 years old France Telecom 45% of the headcount in France is aged 46 to 54 (in fact, each of the 8 biggest age cohorts in the company are in exactly these ages) Some large European banks 60% of workforce is already aged between 40 and 65 Source: Press reports, May 2007
TAKE A LOOK AT OLDER PEOPLE 70 IS THE NEW 50 • HSBC study of 21,000 people aged 40 to 79 years, across 21 countries • Paid work. In OECD, 75% of people in their 50s and half in 60s have some • Paid work for 70-year olds = 20% in USA, 1% in France (which is future?) • Rethinking retirement. Many more men + women in 50s, early 60s plan to: • - “work as long as possible”, or to • - “retire at the full pension age” • Older people feel healthier today. • - People after 60 do things in past only for 40s / 50s e.g. sports, travel, sex • - Only 8% of 70 year olds in OECD feel in poor health (3% Canada, 12% Germ)
Il processo di invecchiamento della popolazione e il mercato del lavoro in Italia I risultati di due indagini: - su un campione di 1000 lavoratori da 50 a 70 anni e su 1000 pensionati da 50 a 70 anni (luglio-ottobre 2003); - su un campione di 175 aziende (novembre 2003-febbraio 2004)
Policies and opinions Figure 7 – Companies according to evaluations about skills and aptitudes of younger and older workers (percentage values; end 2003 – beginning 2004) Q. 15: According to the company’s experience, compare younger (<35) and older (>50) personnel with respect to the aspects listed below Source: survey data, Department of demographic Sciences and ISFOL NB: the 100 difference is represented by the ‘substantial equality
Training Figure 9a - Employed (aged 50-69) who have attended professional training and upgrading courses and period in which the course has taken place (percentage values; June-July 2003) Q. 13: During your professional career, have you been involved in professional training and/or upgrading activities? If yes, Q.13a: When does your last course date back to? Source: survey data, Department of demographic Sciences and ISFOL
Desire of retirement Figure 12a - Employed workers opinion about their desire and motivations for retirement (percentage values; June-July 2003) Q. 20: If it would only depend on you, would you retire: Q. 21a: As soon as possible, and why? Q. 21b: As late as possible, and why? Source: survey data, Department of demographic Sciences and ISFOL
Desire of retirement Figure 13 - The opinion of companies about their workers’ desire to anticipate retirement (percentage values; end 2003 – beginning 2004) Q. 22: Do you think that workers would like to anticipate retirement before achieving the legal retirement age? Source: survey data, Department of demographic Sciences and ISFOL
Respondents’ age Age group Età fino alla quale ci si ritiene capaci di lavorare Figure 14 - The opinion of employed as concern the age until which one mantains a full capability to work, by age Q.14: In your opinion, up to what age could a person at your age and with your work condition work efficiently? Source: survey data, Department of demographic Sciences and ISFOL
Alcuni elementi della strategia della Volkswagen per fronteggiare l’invecchiamento della forza lavoro (da una presentazione di Wilfried Kruger, manager-human resource Volkswagen Braunschweig, Milano, Seminario Adecco, febbraio 2006)
Prejudice of „older deficit“ and influences restricted efficiency of older employees „compartmentation“ and suppression of older employees low flexibility through older employees state of health of older employees assignment of older employees adding little value high personnel expenditure loss of knowledge and experts high health-related absenteeism advancing productivity by „high-tech“- investment low performer discussion low motivation production just for young and fit employees Early retirement programme - control lower qualification for older employees cancellation agreement for older employees – high costs
Volkswagen - Demografical development – forecast by 2024 average age: 45 problem: number of employees with healthy restrictions increases with older age average age: 38 2004 2024 most restrictions: Employee age 53 to 61: 45-60% restrictions Employee age 30 to 40: 20-35% restrictions
Early possibility to leave work Working life account of positive overtime-balances in a year (unit-linked) Agreement to lower working time of older employees Lots of programes to keep work ability Longlife Learning / costs: 50% VW + 50% employees To introduce flexible employment guarantee, for example work2work human resource management – rethink-process/ influences since 1993: Instruments of human resource management • Time-bond • Flexibility ledger with demografical saving accounts • „Altersstafette“ • occupational health promotion • Time for qualification (Auto5000) • „Personaleinsatzbetrieb“ Personal responsibility + Provision of agreed and individualed services
work2work – procedures / assignment Analysis with company physician healthy restrictions original production trans-sectoral production ROUND TABLE human resource, staff association, representative body for disabled employees, line manager, company physician individual work-book contract of integration personnel data • profile of • employee: • work ability • interests • qualification • skills human resource: Knowledge about possibilities of assignment data of working place special skills healthy restrictions fitnessprogram