Download

1 / 26
500 likes | 1.46k Vues
Analysis of Covariance, ANCOVA (GLM2). Aims. When and Why do we use ANCOVA? Partitioning Variance Carrying out on PASW/SPSS Interpretation Main Effects Covariates. When And Why.

E N D
Aims • When and Why do we use ANCOVA? • Partitioning Variance • Carrying out on PASW/SPSS • Interpretation • Main Effects • Covariates
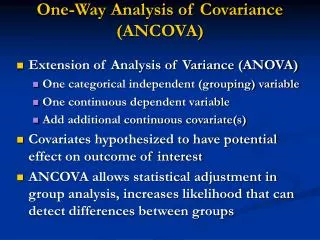
When And Why • To test for differences between group means when we know that an extraneous variable affects the outcome variable. • Used to control known extraneous variables.
Advantages of ANCOVA • Reduces Error Variance • By explaining some of the unexplained variance (SSR) the error variance in the model can be reduced. • Greater Experimental Control: • By controlling known extraneous variables, we gain greater insight into the effect of the predictor variable(s).
SST Total Variance In The Data SSM SSR Improvement Due to the Model Error in Model SSR Covariate Variance
An Example • We will use Field’s (2009) Viagra example (from the ANOVA lecture). • There are several possible confounding variables – e.g. Partner’s libido, medication. • We can conduct the same study but measure partner’s libido over the same time period following the dose of Viagra. • Outcome (or DV) = Participant’s libido • Predictor (or IV) = Dose of Viagra (Placebo, Low & High) • Covariate = Partner’s libido
How Does ANCOVA Work? • Imagine we had just two groups: • Placebo • Low Dose • This paradigm can be expressed as a regression equation using a dummy coding variable:
Dummy Coding • Dummy Coding • Placebo = 0, Low Dose = 1 • When Dose = Placebo, Predicted Libido = mean of placebo group: • When Dose = Low Dose, Predicted Libido = mean of Low Dose group:
ANOVA As Regression • We can run a regression with Libido as the outcome and the Dose (Placebo or Low) as the predictor, Note: • Intercept is the mean of Placebo group • b for the Dummy Variable is the difference between the means of the placebo and low dose group (4.88-3.22 = 1.66)
ANCOVA • ANCOVA extends this basic idea. • The covariate can be added to the regression model of the ANOVA. • To evaluate the effect of the experimental manipulation controlling for the covariate we enter the covariate into the model first (think back to hierarchical regression).
To Recap • To control for the effect of a covariate all we do is do a multiple regression in which we enter the covariate in the first step. • We enter Dose in a second step • The result is that we see the effect of dose above and beyond the effect of the covariate.
Unadjusted Means 4.85 4.88 3.22
The Main Effect F(2, 26) = 4.14, p < .05
The Covariate F(1, 26) = 4.96, p < .05