ANCOVA
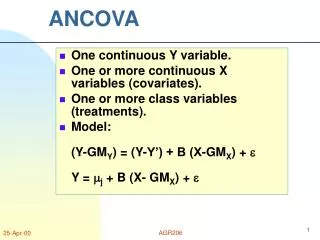
ANCOVA. A hybrid of regression and analysis of variance. Analysis of covariance. It is an analysis of variance performed on residuals from the regression of the response variable on the covariate…. Analysis of covariance. Where Ai is the treatment effect (categorical)

ANCOVA
E N D
Presentation Transcript
ANCOVA A hybrid of regression and analysis of variance
Analysis of covariance • It is an analysis of varianceperformed on residuals from the regression of the response variable on the covariate…
Analysis of covariance Where Ai is the treatment effect (categorical) and Bc is the covariate effect (continuous)
Plotting ANCOVAs • The ANCOVA plot should use the continuous covariate variable plotted on the x-axis, and the continuous response variable plotted on the y-axis. Each point represents an independent replicate, and different symbols or colors should be used for each treatment group.
Possible results A B C D E F
Can you match these explanations to the plots on the previous slide? • Treatment significant, covariate and interaction term non-significant… • Treatment and covariate significant, interaction term non-significant… • Interaction term significant, everything else non-significant… • Covariate not significant, treatment, and interaction significant… • Covariate significant, treatment and interaction non-significant… • No term significant…
Can you match these explanations to the plots on the previous slide? • Treatment significant, covariate and interaction term non-significant (C) • Treatment and covariate significant, interaction term non-significant (D) • Interaction term significant, everything else non-significant (E) • Covariate not significant, treatment, and interaction significant (F) • Covariate significant, treatment and interaction non-significant (B) • No term significant (A)
An important thing… • In Analysis of Covariance order matters! • This model: model <- lm(Y ~ X*Group) • is not the same as this one model <- lm(Y ~ Group*X)
E.G. Membrane potential (in millivolts) 'Action potential' is the name given to the electrical nerve impulse waveform that is generated by the neuron (nerve cell). The shape of an action potential can be seen using an amplifier circuit (voltage clamp) as shown in the diagram below, which measures the flow of ions using two electrodes inserted into the nerve fiber. www.ebme.co.uk/arts/aps/pic1a.gif
E.G. Membrane potential (in millivolts) • Yamauchi and Kimizuka (1971) measured membrane potential for 4 different cation systems as a function of the logarithm of the activity ratio of various electrolytes at various concentrations. We wish to test whether the mean membrane potential “Y” is different for these systems…
We obtain We calculate unexplained sums of squares for these two levels of variation:
We test the null hypothesis that there are no differences among sample means when these are adjusted for a common and a common regression line:
…the results! Sokal and Rohlf, 2000. Biometry
…or you run it in R! Df Sum Sq Mean Sq F value Pr(>F) X 1 4197.0 4197.0 1395.25 < 2.2e-16 *** Group 3 1768.6 589.5 195.98 8.005e-13 *** Residuals 16 48.1 3.0 …from this you can conclude that both the effect of the treatment (cation) and the covariate (concentration) have a significant effect on membrane potential!