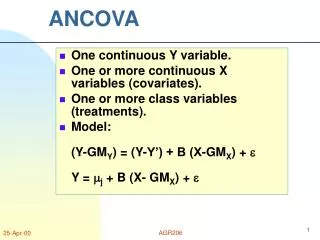
ANCOVA
ANCOVA. Psy 420 Andrew Ainsworth. What is ANCOVA?. Analysis of covariance. an extension of ANOVA in which main effects and interactions are assessed on DV scores after the DV has been adjusted for by the DV’s relationship with one or more Covariates (CVs). Remember Effect Size?.

ANCOVA
E N D
Presentation Transcript
ANCOVA Psy 420 Andrew Ainsworth
Analysis of covariance • an extension of ANOVA in which main effects and interactions are assessed on DV scores after the DV has been adjusted for by the DV’s relationship with one or more Covariates (CVs)
Remember Effect Size? • For basic ANOVA effect size is shown below • What would it look like with a covariate?
Basic requirements 1 DV (I, R) – continuous 1 IV (N, O) – discrete 1 CV (I, R) – continuous
Basic requirements • Minimum number of CVs that are uncorrelated with each other (Why would this be?) • You want a lot of adjustment with minimum loss of degrees of freedom • The change in sums of squares needs to greater than a change associated with a single degree of freedom lost for the CV
Basic requirements • CVs should also be uncorrelated with the IVs (e.g. the CV should be collected before treatment is given) in order to avoid diminishing the relationship between the IV(s) and DV. • How would this affect the analysis?
Covariate • A covariate is a variable that is related to the DV, which you can’t manipulate, but you want to account for it’s relationship with the DV
Applications • Three major applications • Increase test sensitivity (main effects and interactions) by using the CV(s) to account for more of the error variance therefore making the error term smaller
Applications • Adjust DV scores to what they would be if everyone scored the same on the CV(s) • This second application is used often in non-experimental situations where subjects cannot be randomly assigned
Applications • Subjects cannot be made equal through random assignment so CVs are used to adjust scores and make subjects more similar than without the CV • This second approach is often used as a way to improve on poor research designs. • This should be seen as simple descriptive model building with no causality
Applications • Realize that using CVs can adjust DV scores and show a larger effect or the CV can eliminate the effect
Applications • The third application is addressed in 524 through MANOVA, but is the adjustment of a DV for other DVs taken as CVs.
Assumptions • Normality of sampling distributions of the DV and each CV • Absence of outliers – on the DV and each CV • Independence of errors • Homogeneity of Variance • Linearity – there needs to be a linear relationship between each CV and the DV and each pair of CVs
Assumptions • Absence of Multicollinearity – • Multicollinearity is the presence of high correlations between the CVs. • If there are more than one CV and they are highly correlated they will cancel each other out of the equations • How would this work? • If the correlations nears 1, this is known as singularity • One of the CVs should be removed
Assumptions • Homogeneity of Regression • The relationship between each CV and the DV should be the same for each level of the IV
Assumptions • Reliability of Covariates • Since the covariates are used in a linear prediction of the DV no error is assessed or removed from the CV in the way it is for the DV • So it is assumed that the CVs are measured without any error
The variance for the DV is partitioned in the same way Fundamental Equations
Two more partitions are required for ANCOVA, one for the CV And one for the CV-DV relationship Fundamental Equations
The partitions for the CV and the CV/DV relationship are used to adjust the partitions for the DV Fundamental Equations
Fundamental Equations • In other words, the adjustment of any subject’s score (Y – Y’) is found by subtracting from the unadjusted deviation score (Y – GMy) the individuals deviation on the CV (X – GMx) weighted by the regression coefficient • (Y – Y’)= (Y – GMy) – By.x (X – GMx)
Fundamental Equations • Degrees of Freedom • For each CV you are calculating a regression equation so you lose a df for each CV • df’T=N – 1 – #CVs • df’A= are the same • df’S/A=a(n – 1) – #CVs = an – a – #CVs
Analysis • Sums of squares for the DV are the same • Sums of squares for the CV:
Adjusted means • When using ANCOVA the means for each group get adjusted by the CV-DV relationship. • If the Covariate has a significant relationship with the DV than any comparisons are made on the adjusted means.
Specific Comparisons • For BG analyses Fcomp is used • Comparisons are done on adjusted means
Specific Comparisons • Small sample example
Effect Size • Effect size measures are the same except that you calculate them based on the adjusted SSs for effect and error
Applications of ANCOVA Types of designs
Repeated Measures with a single CV measured at each time point
MANOVA syntax MANOVA t1_y t2_y with t1_x t2_x /WSFACTOR = trials(2) /PRINT = SIGNIF(EFSIZE), CELLIFO(MEANS) /WSDESIGN trials /DESIGN.
Note: there are 2 levels for the TRIALS effect. Average tests are identical to the univariate tests of significance. • The default error term in MANOVA has been changed from WITHIN CELLS to • WITHIN+RESIDUAL. Note that these are the same for all full factorial • designs. • * * * * * * A n a l y s i s o f V a r i a n c e * * * * * * • 9 cases accepted. • 0 cases rejected because of out-of-range factor values. • 0 cases rejected because of missing data. • 1 non-empty cell. • 1 design will be processed. • - - - - - - - - - - - - - - - - - - - - - - - - - - - - - - - - - - - • Cell Means and Standard Deviations • Variable .. T1_Y • Mean Std. Dev. N • For entire sample 10.333 2.784 9 • - - - - - - - - - - - - - - - - - - - - - - - - - - - - - - - - - - - • Variable .. T2_Y • Mean Std. Dev. N • For entire sample 15.111 4.428 9 • - - - - - - - - - - - - - - - - - - - - - - - - - - - - - - - - - - - • Variable .. T1_X • Mean Std. Dev. N • For entire sample 7.667 3.742 9 • - - - - - - - - - - - - - - - - - - - - - - - - - - - - - - - - - - - • Variable .. T2_X • Mean Std. Dev. N • For entire sample 7.444 2.789 9 • - - - - - - - - - - - - - - - - - - - - - - - - - - - - - - - - - - -
* * * * * * A n a l y s i s o f V a r i a n c e -- design 1 * * * • Tests of Between-Subjects Effects. • Tests of Significance for T1 using UNIQUE sums of squares • Source of Variation SS DF MS F Sig of F • WITHIN+RESIDUAL 91.31 7 13.04 • REGRESSION 100.80 1 100.80 7.73 .027 • CONSTANT 109.01 1 109.01 8.36 .023 • - - - - - - - - - - - - - - - - - - - - - - - - - - - - - - - - - - - • Effect Size Measures • Partial • Source of Variation ETA Sqd • Regression .525 • - - - - - - - - - - - - - - - - - - - - - - - - - - - - - - - - - - - • Regression analysis for WITHIN+RESIDUAL error term • --- Individual Univariate .9500 confidence intervals • Dependent variable .. T1 • COVARIATE B Beta Std. Err. t-Value Sig. of t • T3 .79512 .72437 .286 2.780 .027 • COVARIATE Lower -95% CL- Upper ETA Sq. • T3 .119 1.471 .525 • - - - - - - - - - - - - - - - - - - - - - - - - - - - - - - - - - - -
* * * * * * A n a l y s i s o f V a r i a n c e -- design 1 * * * • Tests involving 'TRIALS' Within-Subject Effect. • Tests of Significance for T2 using UNIQUE sums of squares • Source of Variation SS DF MS F Sig of F • WITHIN+RESIDUAL 26.08 7 3.73 • REGRESSION .70 1 .70 .19 .677 • TRIALS 99.16 1 99.16 26.62 .001 • - - - - - - - - - - - - - - - - - - - - - - - - - - - - - - - - - - - • Effect Size Measures • Partial • Source of Variation ETA Sqd • Regression .026 • TRIALS .792 • - - - - - - - - - - - - - - - - - - - - - - - - - - - - - - - - - - - • Regression analysis for WITHIN+RESIDUAL error term • --- Individual Univariate .9500 confidence intervals • Dependent variable .. T2 • COVARIATE B Beta Std. Err. t-Value Sig. of t • T4 -.21805 -.16198 .502 -.434 .677 • COVARIATE Lower -95% CL- Upper ETA Sq. • T4 -1.405 .969 .026 • - - - - - - - - - - - - - - - - - - - - - - - - - - - - - - - - - - -