Download
1 / 11
110 likes | 163 Vues
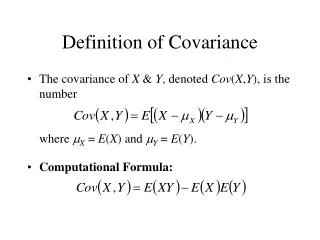
Analysis of Covariance method used to compare head-lengths of trout from Kootenay Lake and Wilson Lake, controlling for body length. Adjusted means were calculated using regression, revealing lake effect differences. ANOVA and statistical tests were conducted to test hypotheses.

E N D
Analysis of Covariance Comparison of Head-Lengths for Trout from 2 Lakes Source: C. McC. Mottley (1941). “The Covariance Method of Comparing the Head-Lengths of Trout From Different Environments,” Copeia, Vol.1941, #3, pp.154-159.
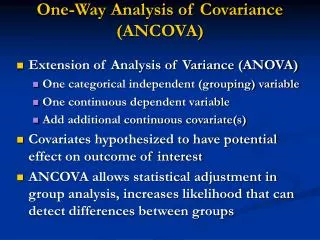
Analysis of Covariance • Goal: To Compare 2 or More Group/Treatment Means for One Variable, after controlling for one or more concomitant variables/Covariates • Procedure: Fit a Regression Model Relating Response to Group (Using Dummy Variables) and Covariate(s) • Adjusted Means: Fitted Values from regression for each group evaluated at common value(s) of covariate(s), typically at the mean value(s) • Treatments can be combinations of factors in a Factorial Structure • Model:
Example – Fale Trout Heads from 2 Lakes (Environments) • Units: Female Fish Sampled from Lakes • Response Variable: Head Length (mm) • Groups: Environments (Kootenay Lake, Wilson Lake) • Covariate: Standard-Length (mm) • Samples: n1 = 50 from Kootenay, n2 = 10 from Wilson • Transformation: Base10 logarithms of Head-Length and Fish-Length Taken for Biological Reasons • Summary Statistics:
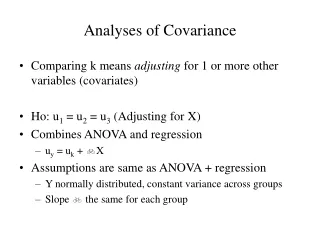
Adjusted Means • Goal: Compare Means Head Lengths after adjusting for Body Lengths • Start with the Unadjusted Mean, and Subtract off the product of the slope from the regression and the difference between the group mean and the overall mean for the covariate. Effect of adjustment (assuming positive slope): • Adjust down for groups with high levels of covariate • Adjust up for groups with low levels of covariate
Testing for Lake Effect, Controlling for Body Length • Null Hypothesis: No difference in mean head lengths for 2 lakes, controlling for Body Length (b1=b2) • Alternative Hypothesis: Lake Means Differ (b1≠b2) • Step 1: Fit Full Model Under HA and obtain SSE(F), dfE(F) • Step 2: Place Restriction under H0 and fit model forcing b1=b2 and obtain SSE(R) and dfE(R) :
Trout Head Size Data ANOVA for Full Model: ANOVA for Reduced Model: