Download
1 / 94
950 likes | 1.1k Vues
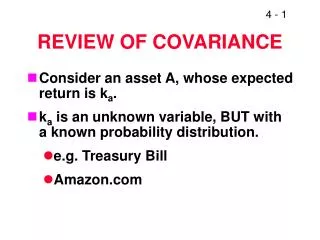
REVIEW OF COVARIANCE. Consider an asset A, whose expected return is k a . k a is an unknown variable, BUT with a known probability distribution. e.g. Treasury Bill Amazon.com. Probability distribution. Amazon. T-Bill. Rate of return (%). -70. 2. 15. 100. Expected Rate of Return.

E N D
REVIEW OF COVARIANCE • Consider an asset A, whose expected return is ka. • ka is an unknown variable, BUT with a known probability distribution. • e.g. Treasury Bill • Amazon.com
Probability distribution Amazon T-Bill Rate of return (%) -70 2 15 100 Expected Rate of Return
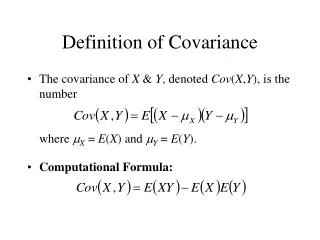
What’s the formula for the standard deviation and variance? = Standard deviation .
What’s the formula for the Covariance? = Covariance (kai - ka)(kbi - kb) Pi
COVARIANCE • If A and B move up and down together, • the covariance will be positive. • If A and B move counter to one another, • the covariance will be negative • If A and B move with no relation, • the covariance will be small.
COVARIANCE • If the return on either stock is highly uncertain, • cov will tend to be large, but a random relation may cancel this. • If either stock has zero STD DEV, • COV will be zero.
COVARIANCE SUMMARY • COV(A,B) will be large and positive if: returns on assets have large standard deviations and move together. • COV(A,B) will be large and negative if: returns on assets have large standard deviations and move counter to one another.
COVARIANCE SUMMARY • COV(A,B) will be tend to be small if: • returns move randomly, rather than up and down with one another; and/or either has a small standard deviation.
CORRELATION COEFFICIENT • rab = COV(A,B) • StdDev(A)xStdDev(B) • COV(A,B)=rab [StdDev(A)xStdDev(B)] • SCATTER DIAGRAMS
ka kb
ka kb
ka kb
PORTFOLIO VARIANCE: TWO ASSET CASE • VAR(P) = (x2)Var(A) + (1-x)2Var(B) + (2)(x)(1-x) COV(A,B) • where • x=proportion of portfolio in Asset A
PORTFOLIO VARIANCE: THREE ASSET CASE • VAR(P) = (xA)2 Var(A) + (xB)2Var(B) + (xC)2Var(C) + 2 xAxB cov(A,B)+ 2 xAxC cov(A,C) + 2 xBxC cov(B,C) • where • xA = proportion in asset A • xB = proportion in asset B • xC = proportion in asset C • (xA + xB+ XC) =1 • n.b. there are nc2 covariance terms.
CHAPTER 4 Risk and Return: The Basics • Strange event in intellectual history • Basic return concepts • Basic risk concepts • Stand-alone risk • Portfolio (market) risk • Risk and return: CAPM/SML
What are investment returns? • Investment returns measure the financial results of an investment. • Returns may be historical or prospective (anticipated). • Returns can be expressed in: • Dollar terms. • Percentage terms.
What is the return on an investment that costs $1,000 and is soldafter 1 year for $1,100? • Dollar return: $ Received - $ Invested $1,100 - $1,000 = $100. • Percentage return: $ Return/$ Invested $100/$1,000 = 0.10 = 10%.
What is investment risk? • Typically, investment returns are not known with certainty. • Investment risk pertains to the probability of earning a return less than that expected. • The greater the chance of a return far below the expected return, the greater the risk. • Since investors are risk averse, an asset with a larger std.dev. Implies a greater investment risk.
Probability distribution Stock X Stock Y Rate of return (%) -20 0 15 50 • Which stock is riskier? Why?
Minicase 4p.168 Simple?
What is unique about the T-bill return? • The T-bill will return 8% regardless of the state of the economy. • Is the T-bill riskless? Explain.
Do the returns of Alta Inds. and Repo Men move with or counter to the economy? • Alta Inds. moves with the economy, so it is positively correlated with the economy. This is the typical situation. • Repo Men moves counter to the economy. Such negative correlation is unusual. • Market portfolio: ? • American Foam: ? See graph AM F
Calculate the expected rate of return on each alternative. ^ r = expected rate of return. ^ rAlta = 0.10(-22%) + 0.20(-2%) + 0.40(20%) + 0.20(35%) + 0.10(50%) = 17.4%. See minicase 4
^ • Alta has the highest rate of return. • Does that make it best? Sumproduct function
What is the standard deviationof returns for each alternative?
T-bills = 0.0%. Repo = 13.4%. Am Foam = 18.8%. Market = 15.3%. Alta = 20.0%. Alta Inds: = ((-22 - 17.4)20.10 + (-2 - 17.4)20.20 + (20 - 17.4)20.40 + (35 - 17.4)20.20 + (50 - 17.4)20.10)1/2 = 20.0%.
Prob. T-bill Am. F. Alta 0 8 13.8 17.4 Rate of Return (%)
Standard deviation measures the stand-alone risk of an investment. • The larger the standard deviation, the higher the probability that returns will be far below the expected return. • Coefficient of variation is an alternative measure of stand-alone risk.
Expected Return versus Risk Can any of these be excluded? See Spreadsheet Chart: Northwest Rule in Graph-Investments
It is tempting to say that T-Bills are least risky and HT is most risky; but • Before reaching a conclusion, we must consider: • magnitudes of expected returns (thus C.V) • skewness of distributions • our confidence in the prob. distributions • relationship between each asset and other assets that might be held.
Coefficient of Variation (CV) Standardized measure of dispersion about the expected value: Std dev CV = = . ^ Mean k Shows risk per unit of return.
Asset X KX = 30% StdDev(X)= 10% Asset Y KY = 10% StdDev(Y)= 5% Example illustrating C.V.Consider two Assets: X & YWhich has more risk?
Asset X KX = 30% StdDev(X)= 10% What is the probability that each asset will have a return < 10%? Asset Y KY = 10% StdDev(Y)= 5% Example illustrating C.V.Consider two Assets: X & YWhich has more risk?
Asset X KX = 30% StdDev(X)= 10% CV(X)=.10/.30=.33 Asset Y KY = 10% StdDev(Y)= 5% CV(Y)=.05/.10=.5 Example illustrating C.V.Consider two Assets: X & YWhich has more risk?
X Y 0 X>Y , but Y is riskier. Or Alternative Graph : CVY> CVX. ^ k
30% 10% 0%
Coefficient of Variation:CV = Standard deviation/expected return CVT-BILLS = 0.0%/8.0% = 0.0. CVAlta Inds = 20.0%/17.4% = 1.1. CVRepo Men = 13.4%/1.7% = 7.9. CVAm. Foam = 18.8%/13.8% = 1.4. CVM = 15.3%/15.0% = 1.0.
Portfolio Risk and Return Assume a two-stock portfolio with $50,000 in Alta Inds. and $50,000 in Repo Men. ^ Calculate rp and p.
Portfolio Return, rp ^ ^ rp is a weighted average: n ^ ^ rp = wiri i = 1 ^ rp = 0.5(17.4%) + 0.5(1.7%) = 9.6%. ^ ^ ^ rp is between rAlta and rRepo.
Alternative Method Estimated Return ^ rp = (3.0%)0.10 + (6.4%)0.20 + (10.0%)0.40 + (12.5%)0.20 + (15.0%)0.10 = 9.6%. (More...)
p = ((3.0 - 9.6)20.10 + (6.4 - 9.6)20.20 + (10.0 - 9.6)20.40 + (12.5 - 9.6)20.20 + (15.0 - 9.6)20.10)1/2 = 3.3%. • p is much lower than: • either stock (20% and 13.4%). • average of Alta and Repo (16.7%). • The portfolio provides average return but much lower risk. • Reason: ? • See spreadsheet for alternate calculation.
Two-Stock Portfolios • Two stocks can be combined to form a riskless portfolio if r = -1.0. • Risk is not reduced at all if the two stocks have r = +1.0. • In general, stocks have r 0.65, so risk is lowered but not eliminated. • Investors typically hold many stocks. • What happens when r = 0?
General Statements About Risk • Most stocks are positively correlated. rk,m 0.65. • 35% for an average stock. • Combining stocks generally lowers risk.